
Social
To sign up to receive the latest Canadian Energy Centre research to your inbox email: research@canadianenergycentre.ca
Download the PDF here
Download the charts here
Overview
Since the energy price downturn in late 2014, and the imposition of increased regulatory burdens and delays by the federal government, beginning in 2015, upstream oil and gas capital expenditures (capex) and government revenues have lagged.
However, there are now definite signs that Canadian upstream oil and gas capex and government revenues are recovering and expanding due to a higher energy price environment: combined with rising global energy demand, increased attention being paid to energy security, and an emphasis on maintaining high environmental standards.
This Fact Sheet examines projected Canadian upstream oil and gas capex and government revenues over the next decade under an average $80 US per barrel Brent price trajectory. The upstream capex and government revenue numbers are expressed in nominal US dollars, assuming a 2.5 per cent inflation rate and a 10 per cent discount rate.
The written content in this report was prepared by the Canadian Energy Centre (CEC) and does not represent the views of Rystad Energy.
Background on Rystad Energy UCube
Rystad Energy is an independent energy research company providing data, analytics and consultancy services to clients around the globe.
UCube is Rystad Energy’s global upstream database, including production and economics (costs, revenues, and valuations) for more than 80,000 assets, covering the portfolios of more than 3,500 companies.
The UCube data set is used to study all parts of the global exploration and production (E&P) activity value chain, including operational costs, investment (capex and opex), fiscal terms, and net cash flows for projects and companies, both globally and by country (Rystad Energy, 2023).
We use a relatively conservative price trajectory for our analysis of capex and government revenues, with crude oil prices projected to average $80 U.S. per barrel Brent between 2023 and 2032.
Projected Canadian upstream oil and gas government revenues to exceed U.S. $495 billion over the next decade
Under the $80 US per barrel price trajectory, upstream oil and gas government revenue (which includes provincial royalties and federal and provincial corporate taxes) in Canada is expected to rise from U.S. $35.2 billion in 2023 to U.S. $65.8 billion in 2032.
On a cumulative basis, between 2023 and 2032, Canadian upstream oil and gas revenue is projected at U.S. $495.2 billion under an $80 US per barrel price trajectory (see Figure 1). At the current exchange rate, this would be about 20 per cent more in Canadian dollars.
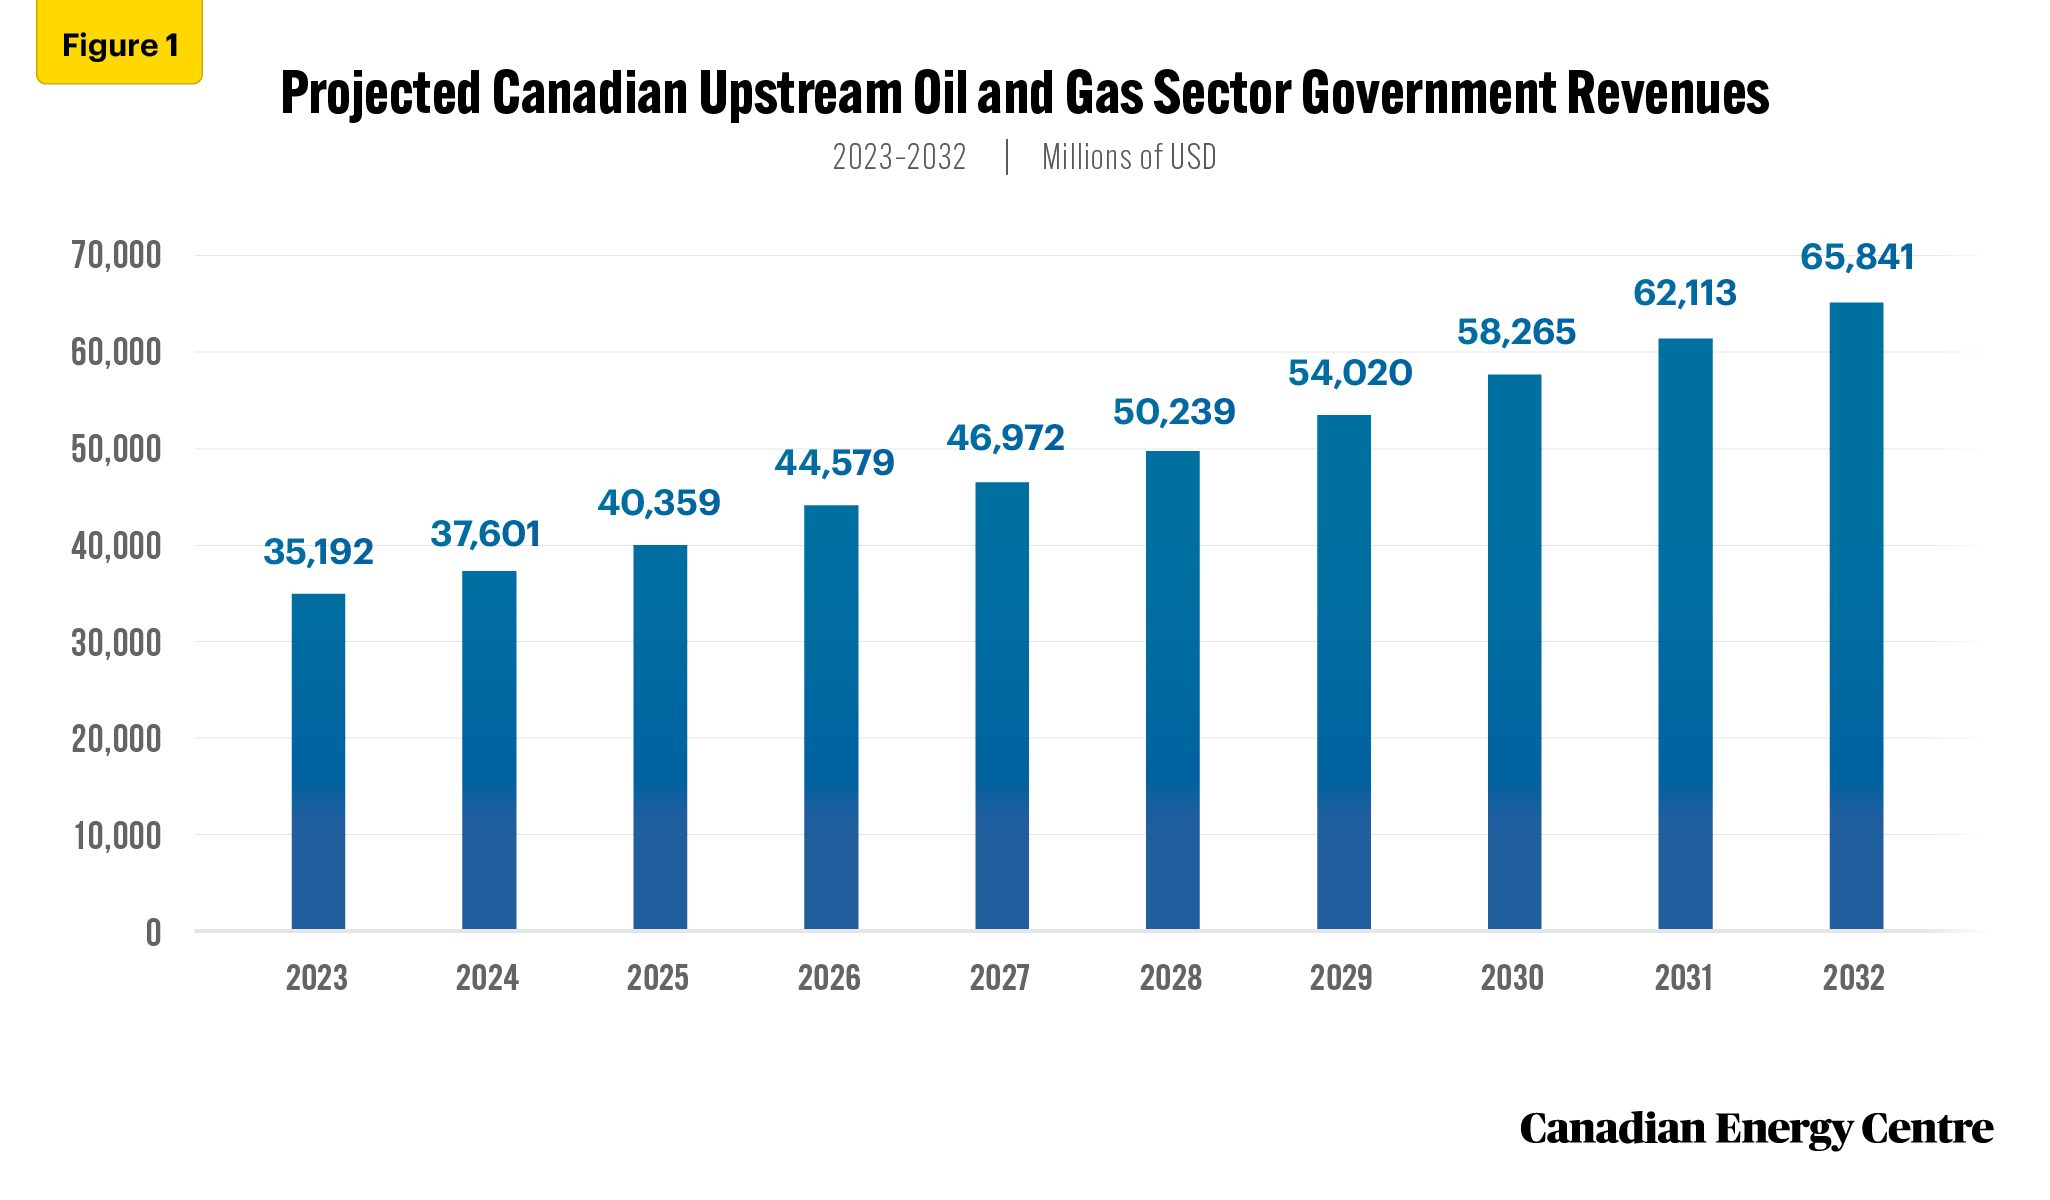
Source: Derived from the Rystad Energy UCube
Projected Canadian upstream oil and gas capital expenditures (capex) to exceed U.S. $375 billion over the next decade
Under the $80 US per barrel price trajectory, upstream oil and gas capex in Canada is expected to rise from U.S. $28.2 billion in 2023 to U.S. $47.9 billion in 2032.
On a cumulative basis, between 2023 and 2032, Canadian upstream oil and gas capex is projected at U.S. $375.4 billion under an $80 US per barrel price trajectory (see Figure 2). At the current exchange rate, this would be about 20 per cent more in Canadian dollars.
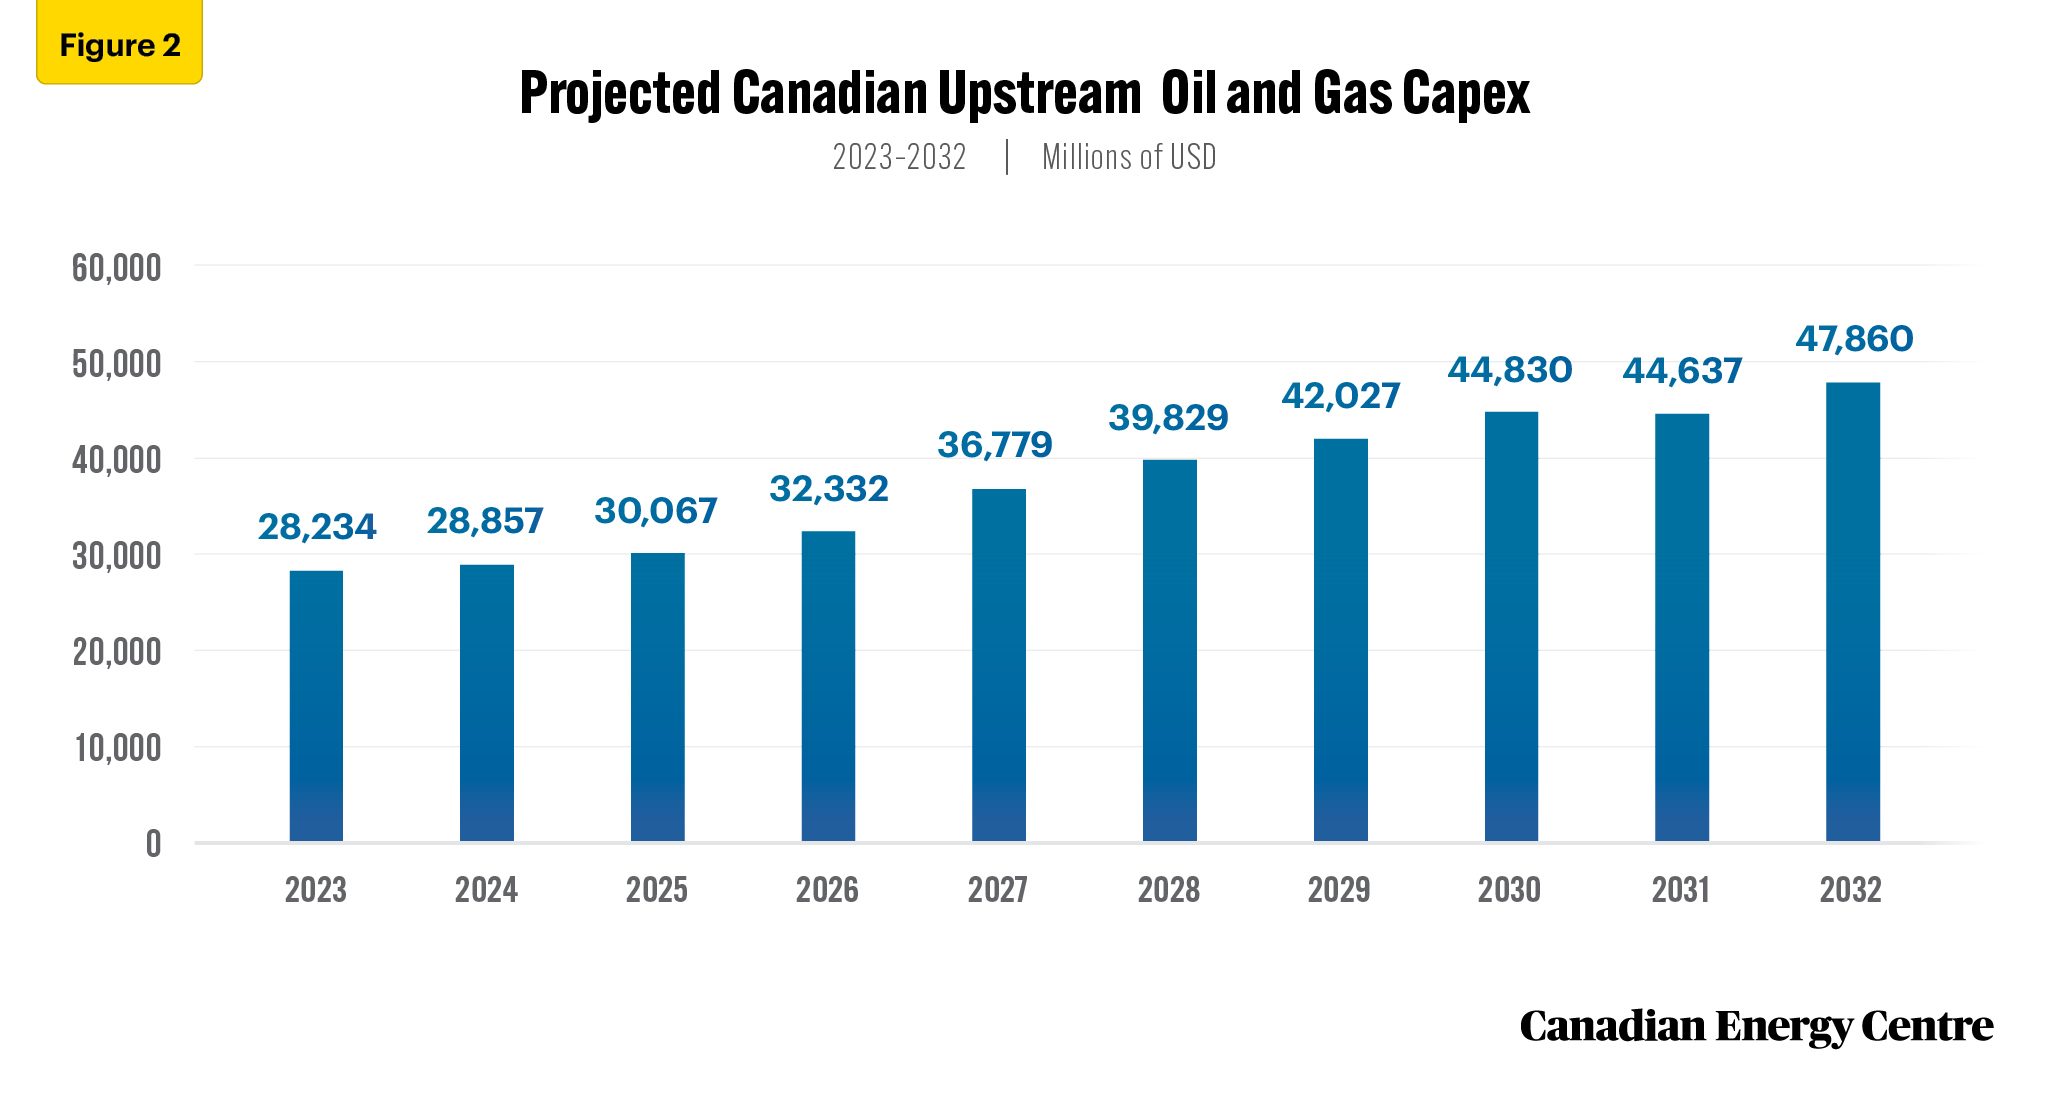
Source: Derived from the Rystad Energy UCube
Conclusion
The projected government revenue and capex numbers over the next decade are an indicator of the health of the Canadian oil and gas industry.
With these numbers, the sector has an opportunity to play a key role as a safe, secure, reliable and clean supplier of oil and gas to a world that is facing potential energy disruptions arising from geopolitical conflict.
Notes
This CEC Fact Sheet was compiled by Lennie Kaplan at the Canadian Energy Centre (www.canadianenergycentre.ca). The author and the Canadian Energy Centre would like to thank and acknowledge the assistance of Dennis Sundgaard and two anonymous reviewers in reviewing the data and research for this Fact Sheet.
The written content in this report was prepared by the Canadian Energy Centre (CEC) and does not represent the views of Rystad Energy.
Reference (link live as of January 9, 2022)
Rystad Energy UCube. (2023). <https://bit.ly/3veaMIV>.
Creative Commons Copyright
Research and data from the Canadian Energy Centre (CEC) is available for public usage under creative commons copyright terms with attribution to the CEC. Attribution and specific restrictions on usage including non-commercial use only and no changes to material should follow guidelines enunciated by Creative Commons here: Attribution-NonCommercial-NoDerivs CC BY-NC-ND.