To sign up to receive the latest Canadian Energy Centre research to your inbox email: research@canadianenergycentre.ca
Download the PDF here
Download the charts here
The following summary facts and data were drawn from 26 Fact Sheets and 5 Research Briefs and various research snapshots released in 2022 by the Canadian Energy Centre. For sources and methodology, as well as additional data and information, the 31 original reports are available at the research portal on the Canadian Energy Centre website at canadianenergycentre.ca
Environment
1.
Canada’s share of global CO2 emissions
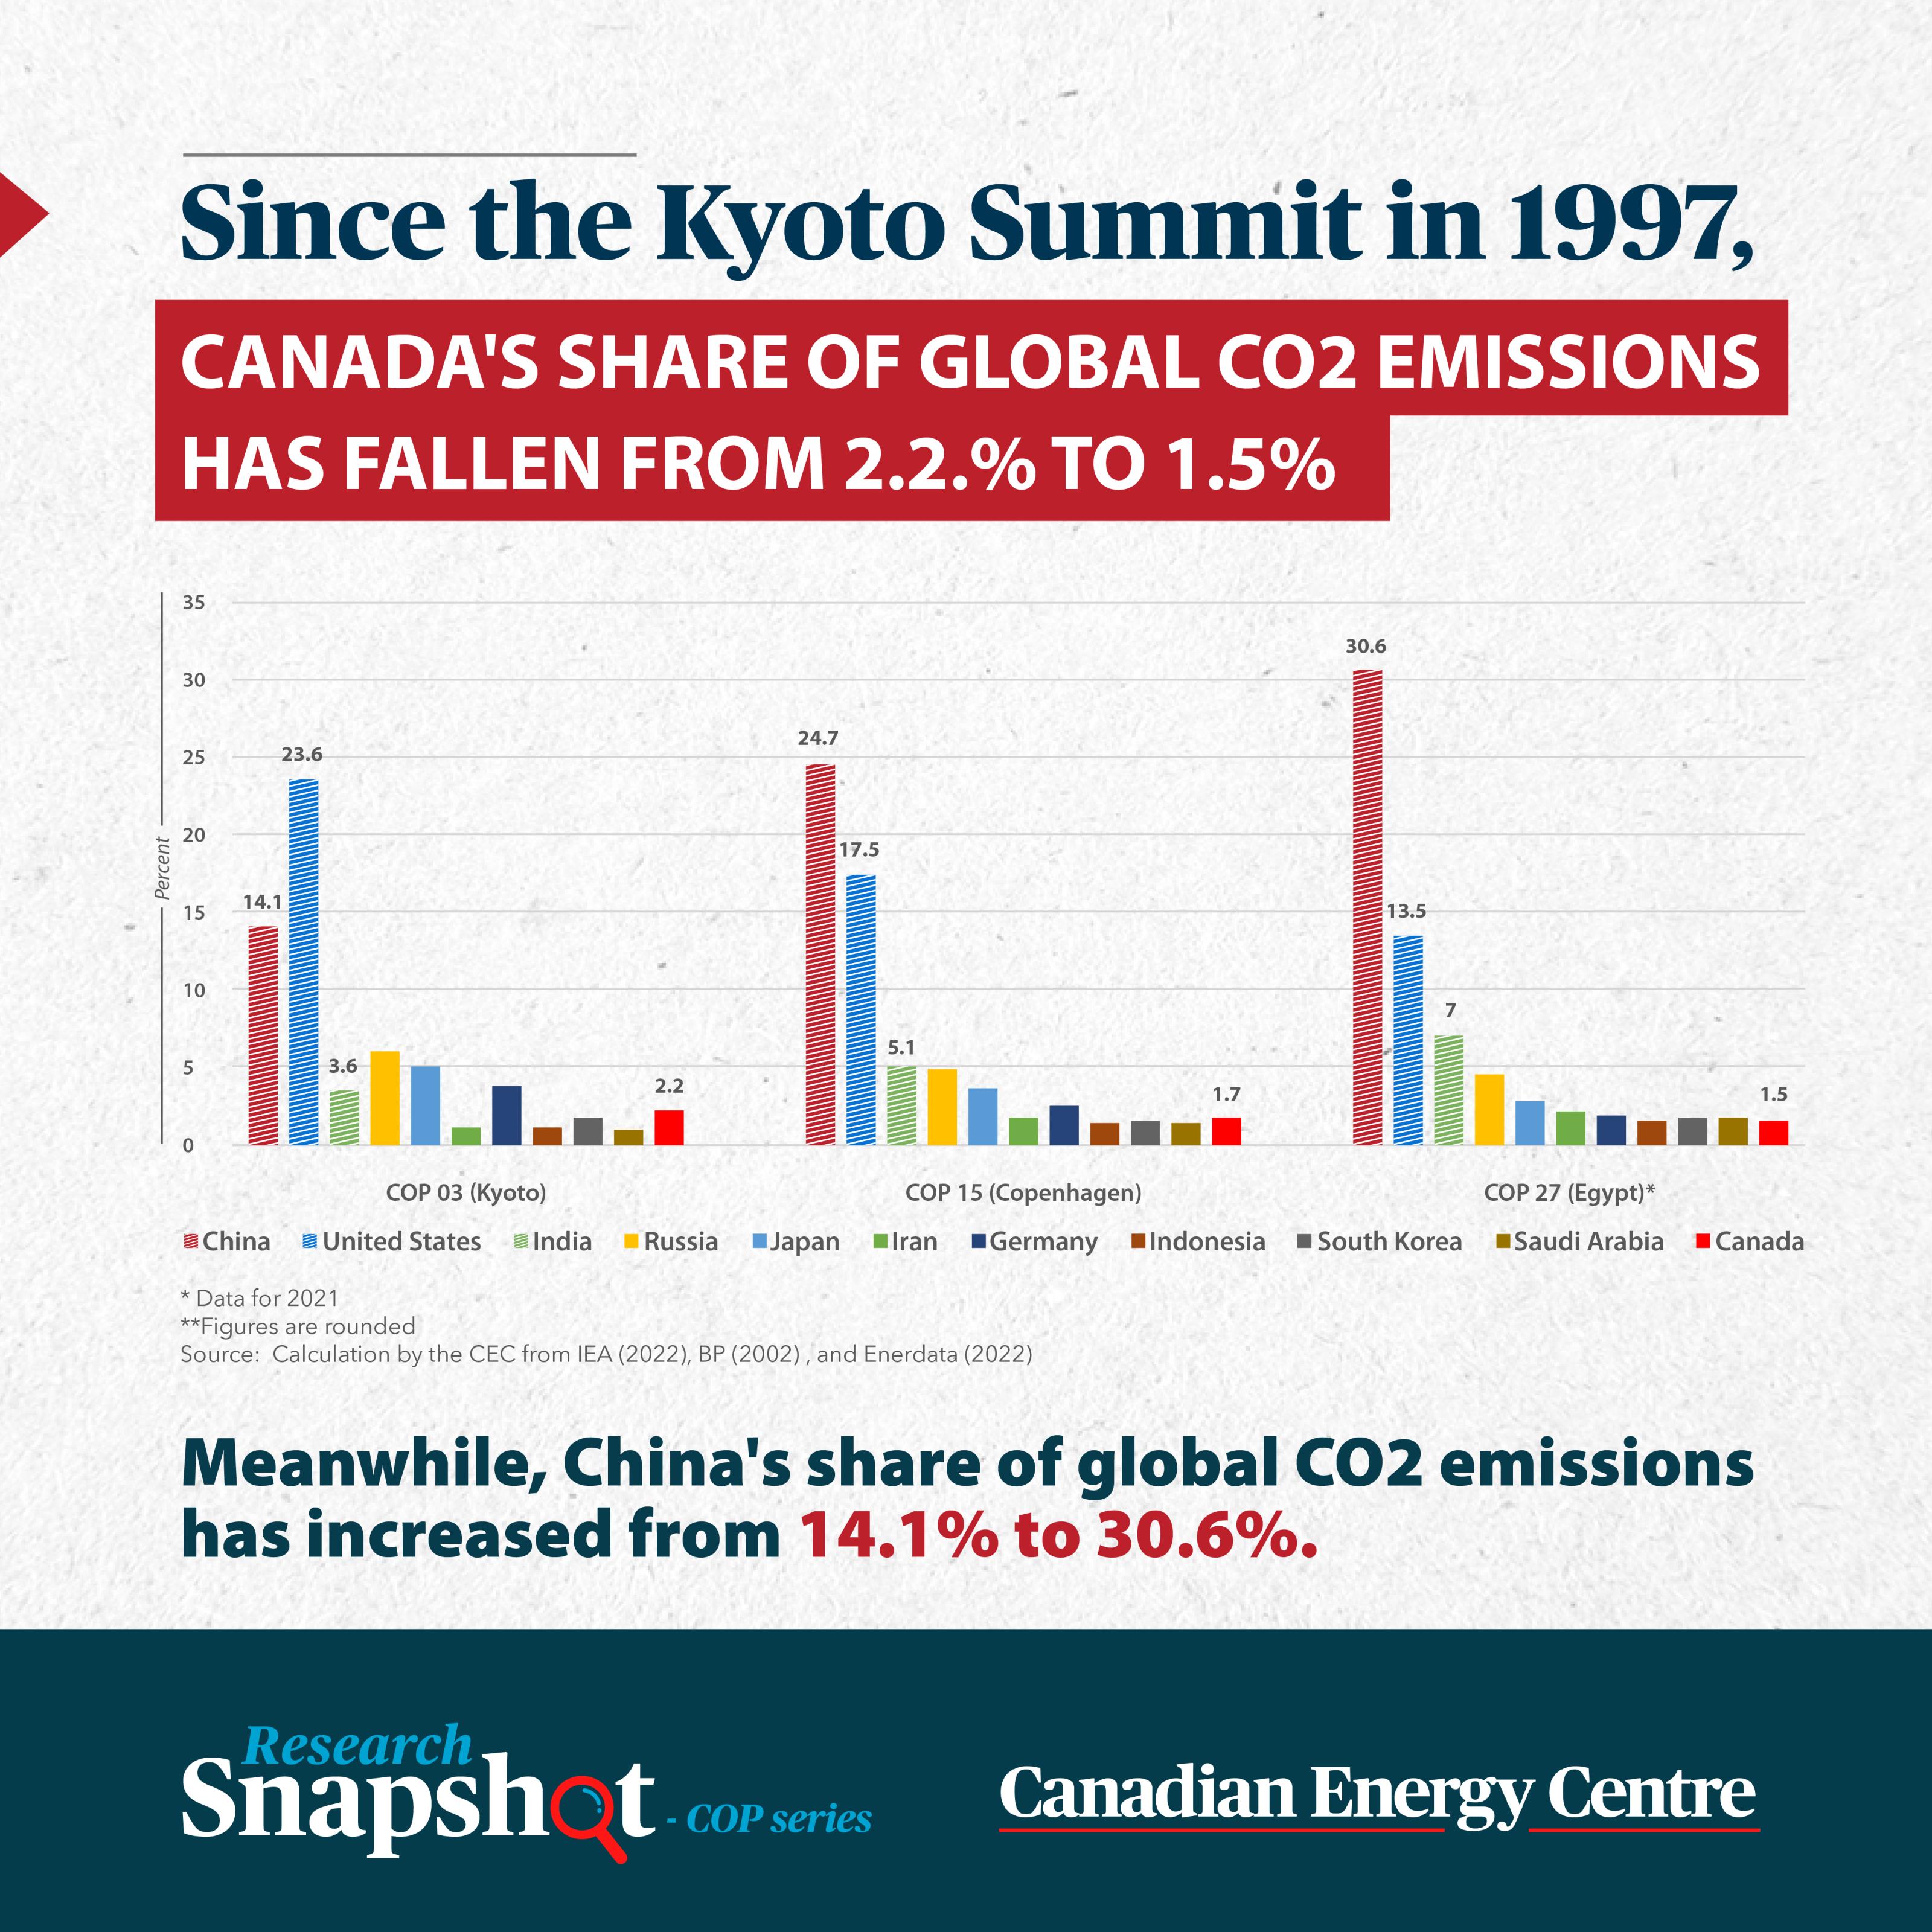
Canada’s CO2 emissions are 1.5 per cent of total worldwide CO2 emissions. Since the Kyoto Summit in 1997, Canada’s share of the world’s CO2 emissions has fallen from 2.2 per cent to 1.5 per cent.
2.
Canadian oil sands are getting cleaner
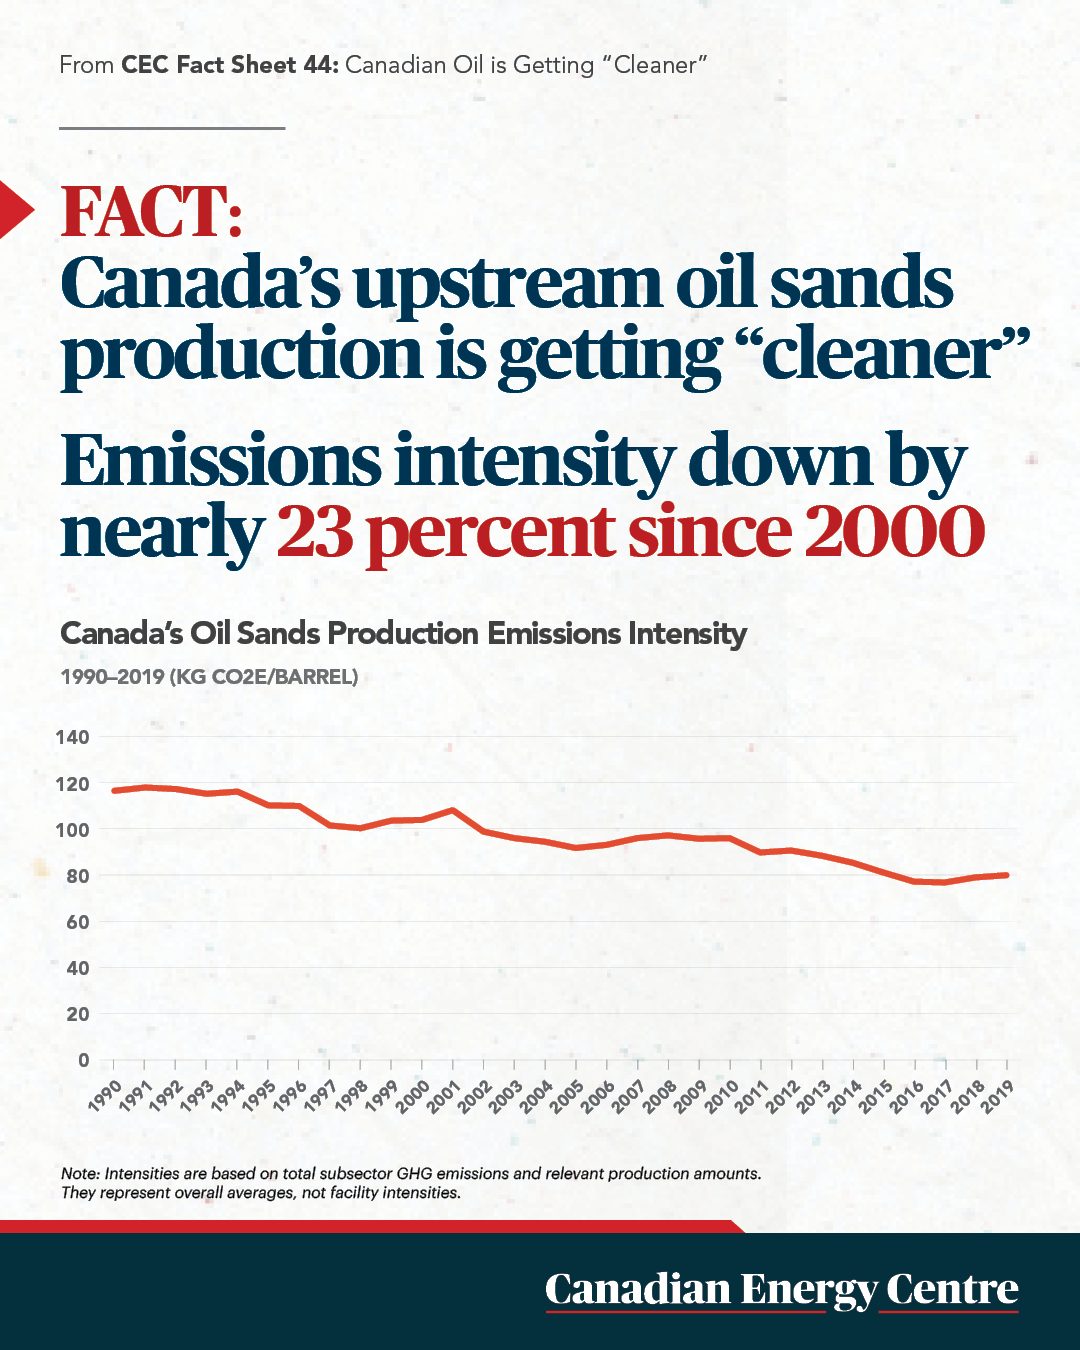
Emissions intensity is the emission rate of a given pollutant relative to the intensity of a specific activity or industrial production process. Emissions intensity is determined by dividing the number of absolute emissions by some unit of output, such as GDP, energy used, population, or barrel of oil produced. Between 2000 and 2019, the GHG emissions intensity of Canada’s oil sands subsector declined by nearly 23 per cent.
3.
Canada’s conventional oil sector is getting cleaner
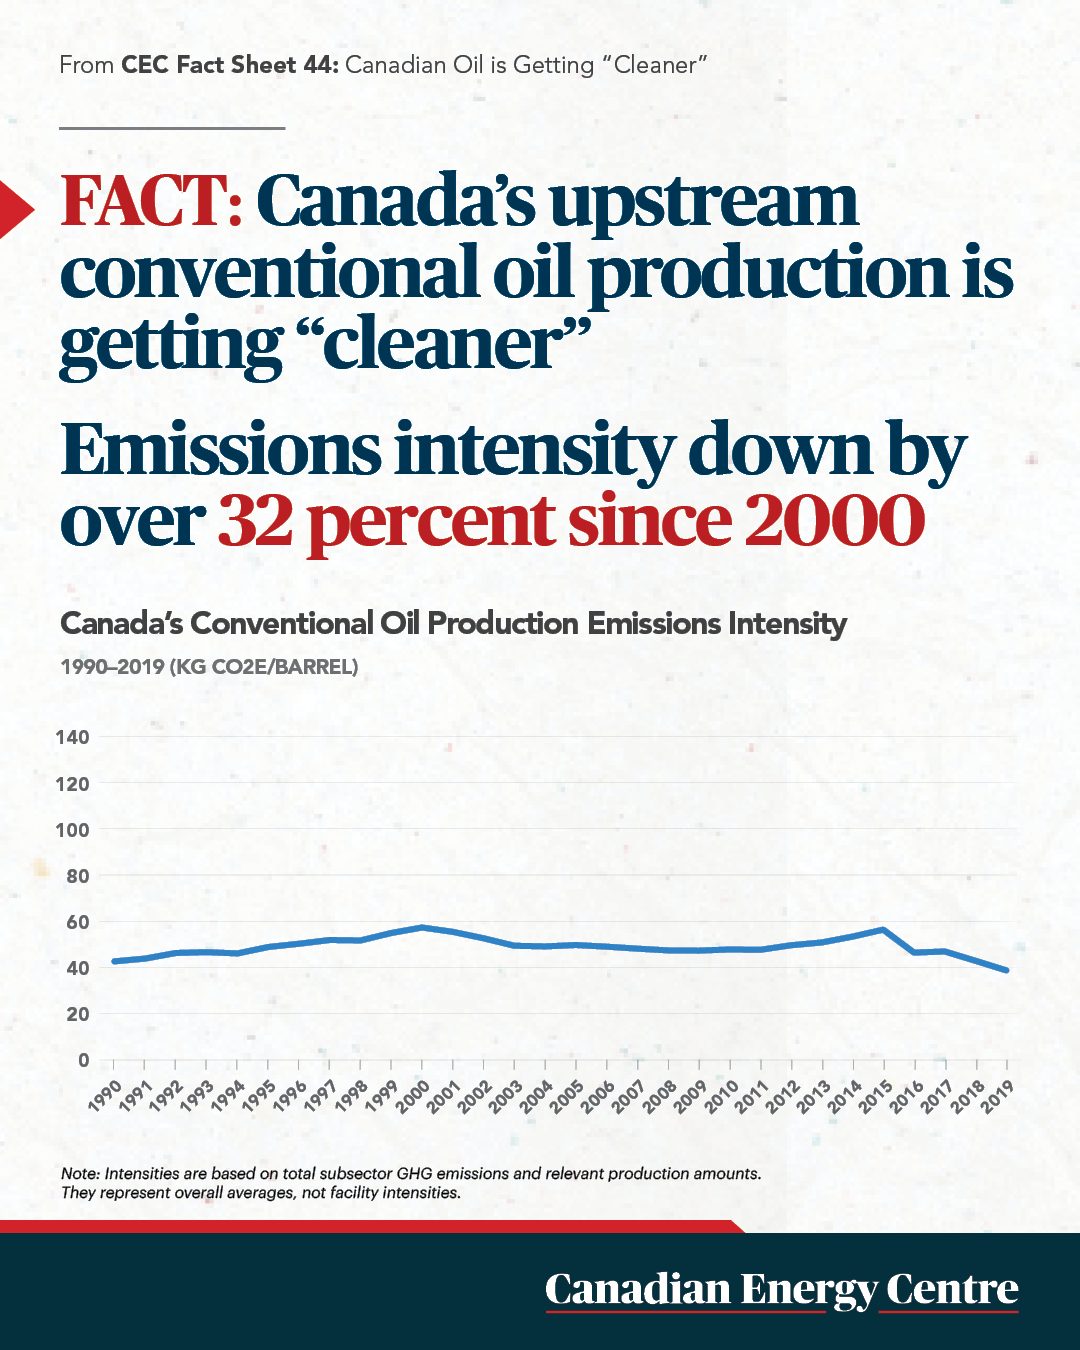
Between 2000 and 2019, GHG emissions intensity in Canada’s conventional oil sector decreased more than 32 per cent. As GHG emissions intensity in the upstream oil sector continues to decline and while Canada’s ESG performance remains highly rated, Canadian oil has the potential to become the barrel of choice on the world stage.
4.
The oil and gas sector and methane emissions
Methane is between 28 and 34 times more potent as a greenhouse gas than carbon dioxide (CO2). According to the International Energy Agency (IEA), there was 591.3 million tonnes (Mt) of methane emitted globally in 2020. The most significant human-caused source of methane emissions is agriculture, which accounted for 145.0 Mt that year, or nearly 25 per cent of all methane emissions. The oil and gas sector emitted an estimated 77.3 MT of methane in 2020—about 13 per cent of methane emitted globally.
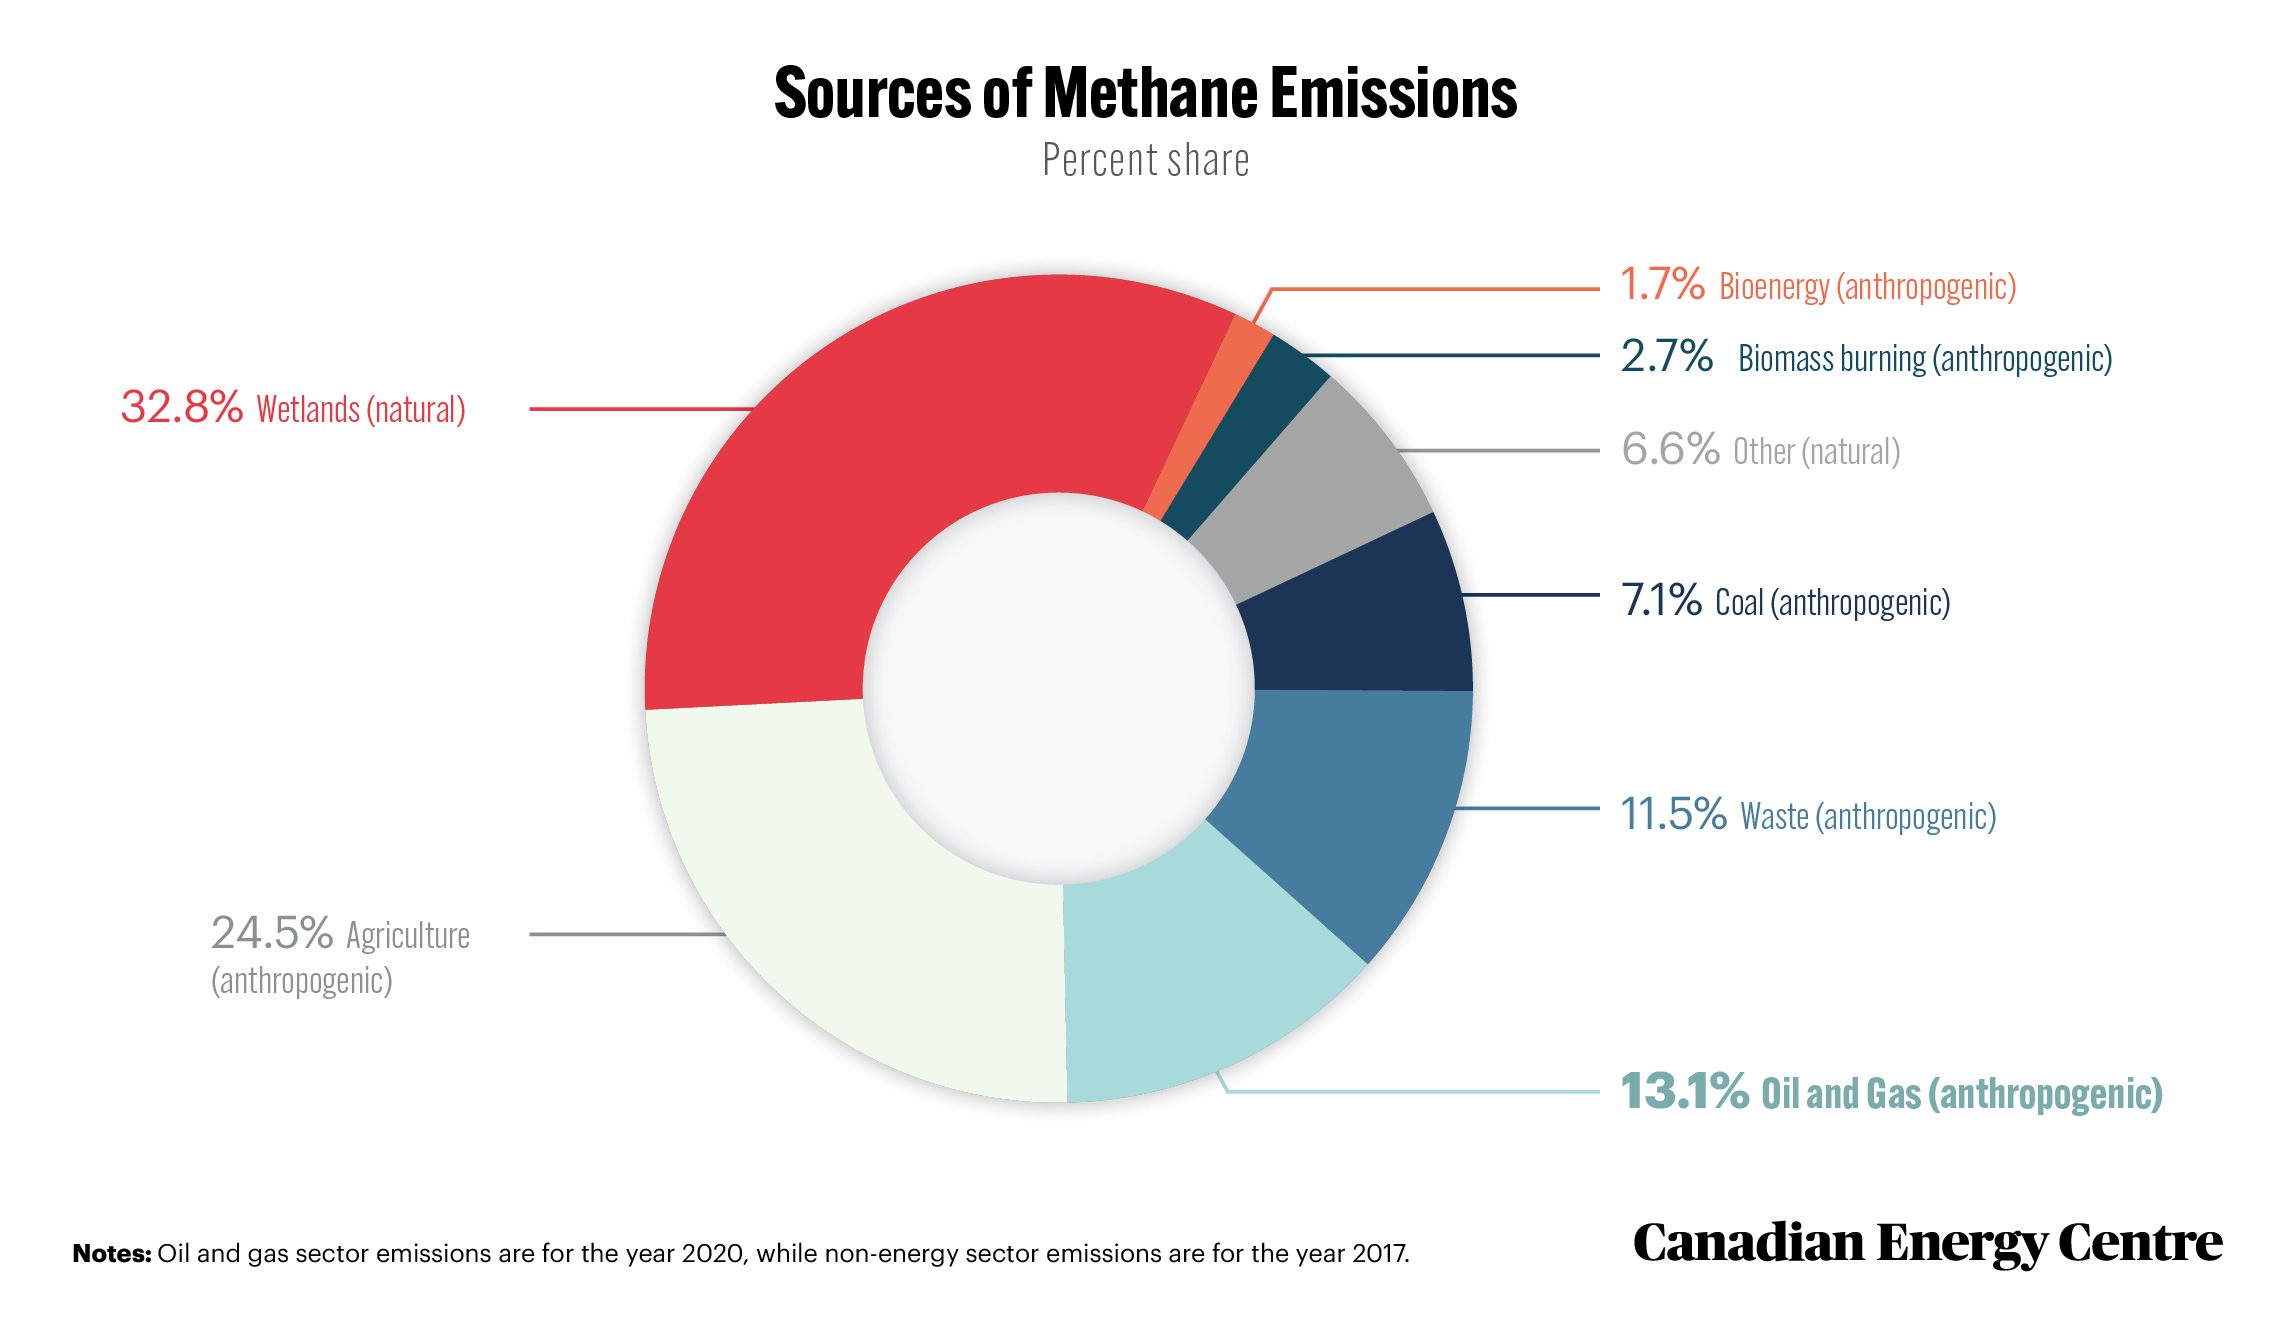
Source: IEA (2021a), and percentage share calculation by authors.
5.
Canada’s oil and gas sector is doing its part to reduce methane emissions
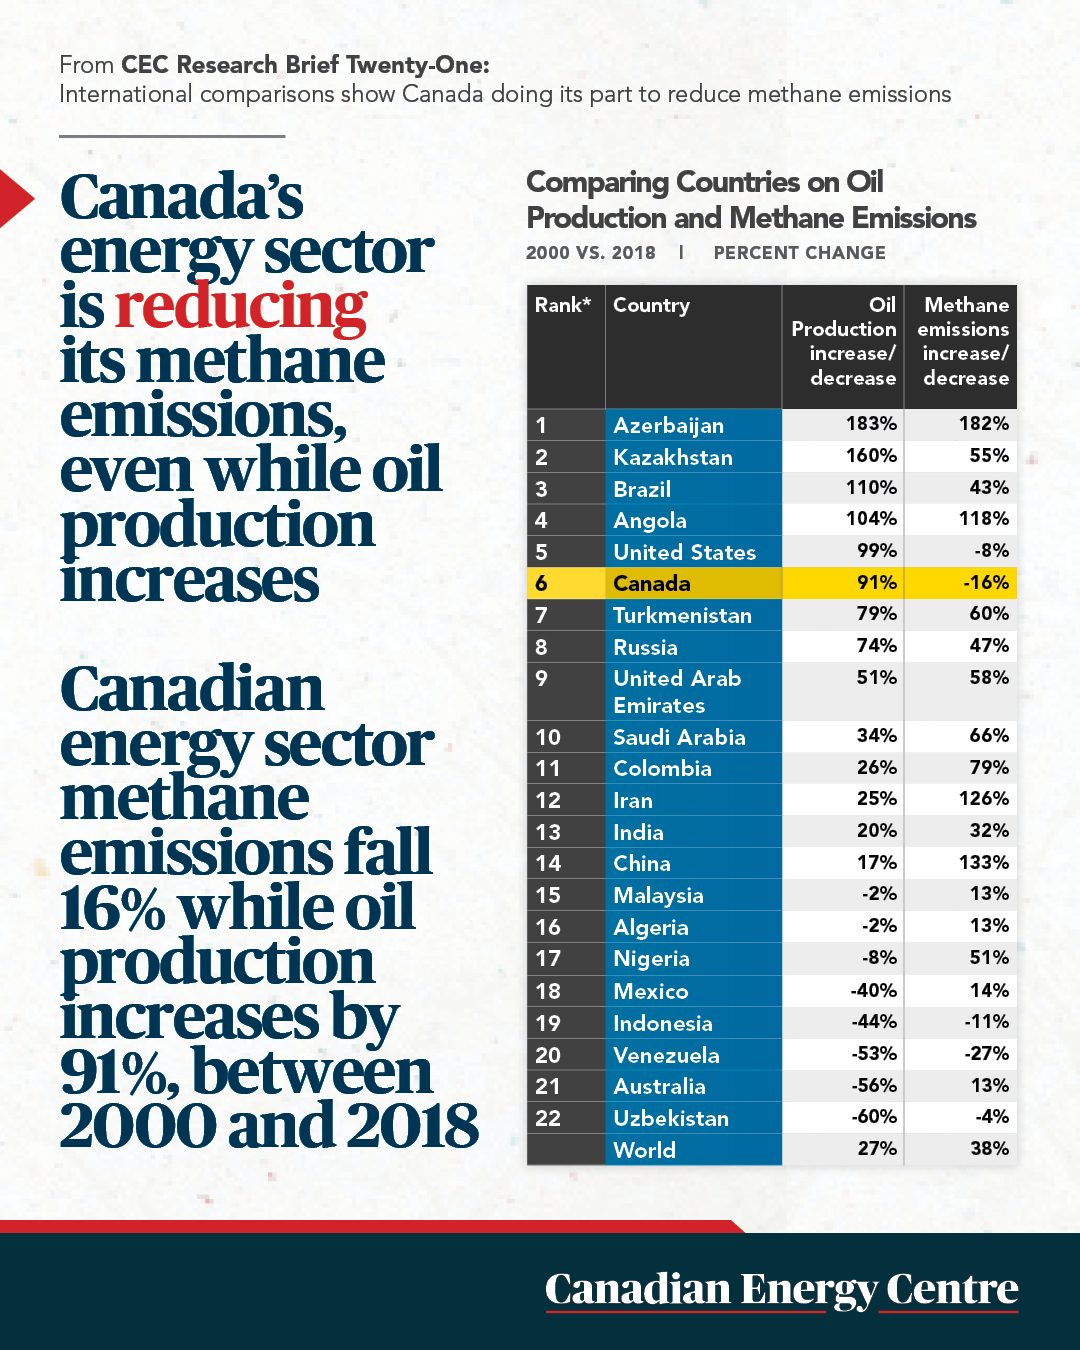
Methane emissions intensity of Canada’s oil and gas industry is one of the lowest among major energy producers. Between 2000 and 2018, Canada was one of only five countries in which the oil and gas sector reduced methane emissions. Canada’s methane emissions fell by 16 per cent, even as the country’s oil production increased by 91 per cent between 2000 and 2018.
6.
Canada’s natural gas emissions intensity is falling
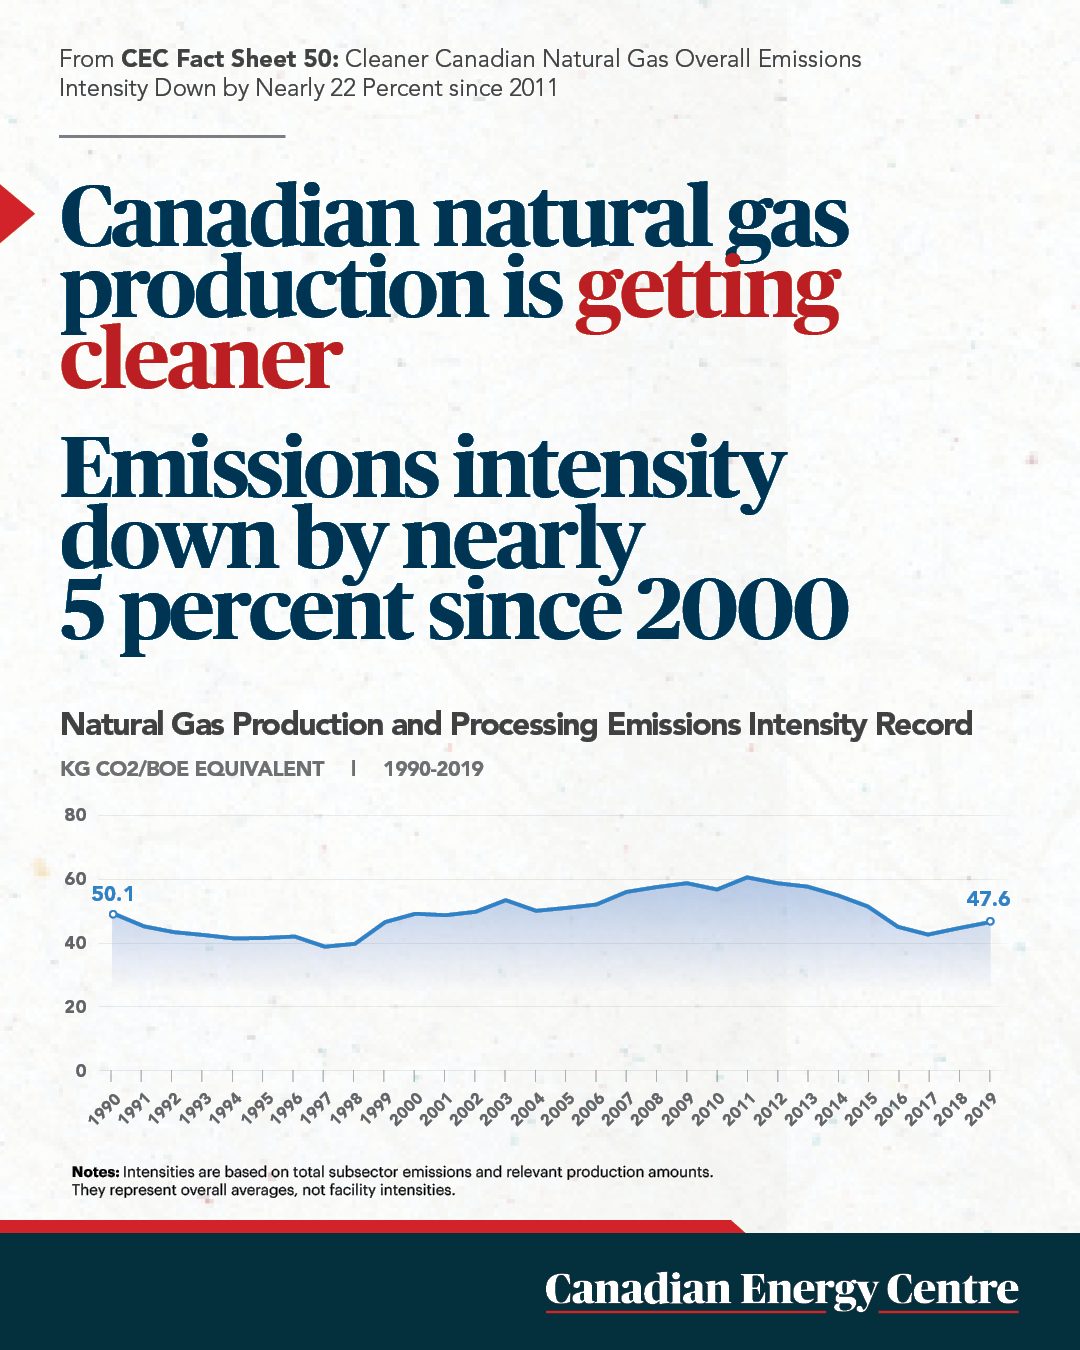
Between 2000 and 2019, the GHG emissions intensity of Canadian natural gas production fell from 50 kilograms of CO2 per barrel of oil equivalent (boe) in 2000 to just under 48 kilograms of CO2 per boe in 2019, an overall reduction of nearly five per cent. Between 2011 and 2019, the GHG emissions intensity of Canadian natural gas production fell from slightly under 61 kilograms of CO2 per boe to nearly 48 kilograms of CO2 per boe, a decline of about 22 per cent.
7.
Gas flaring across the world
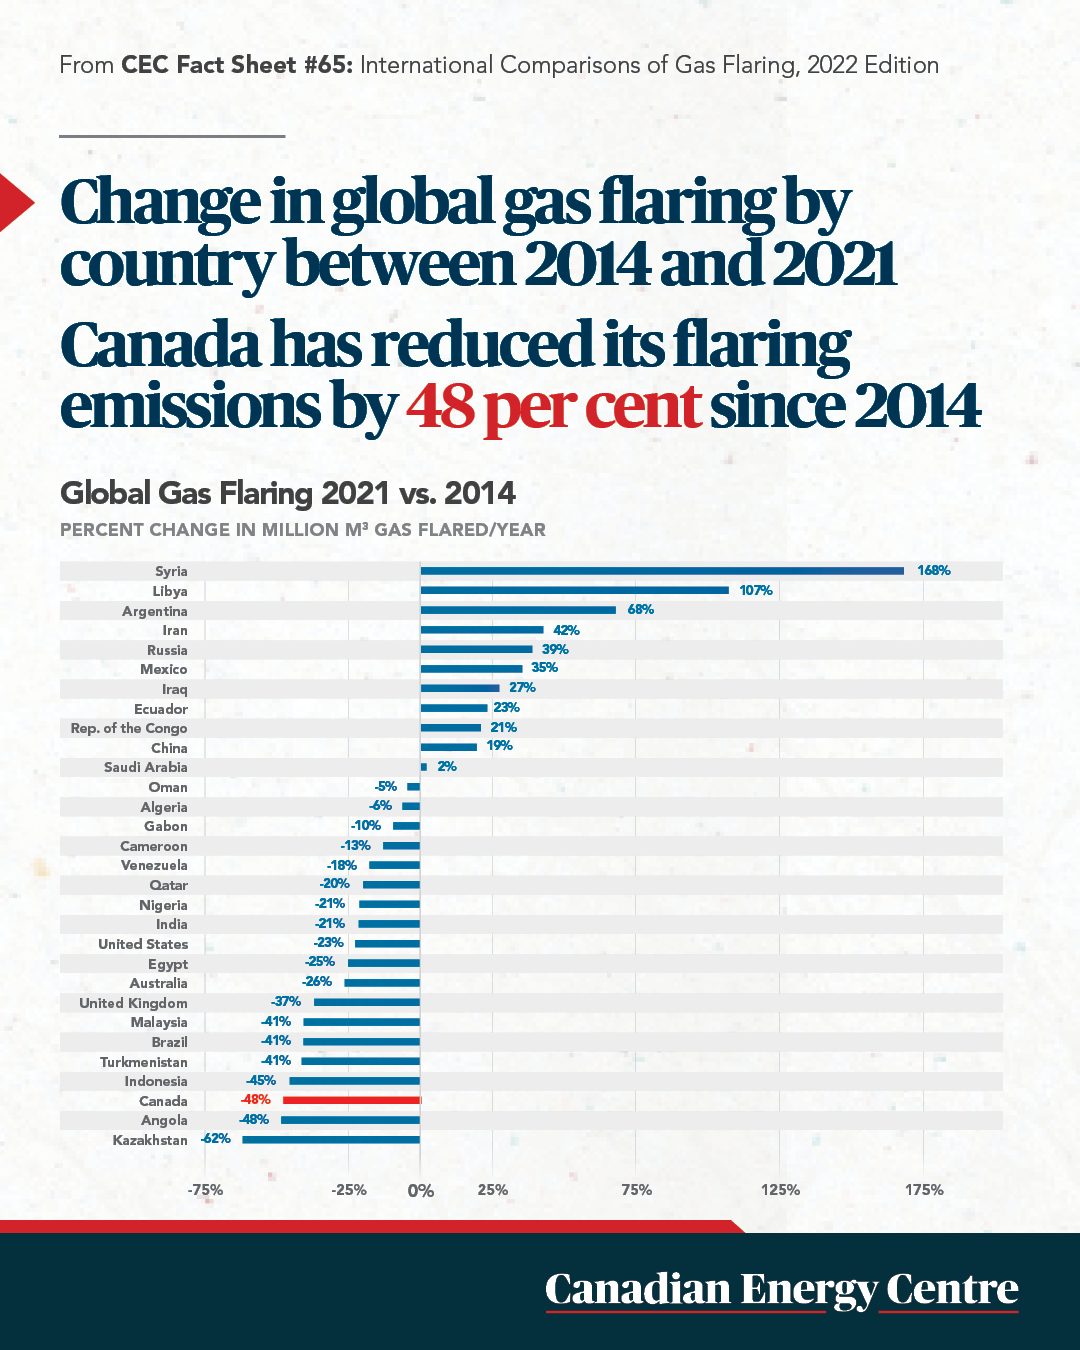
Gas flaring, the burning off of gas generated in the oil and gas production process, is a significant greenhouse gas contributor. In 2021, 19 countries flared more than they did in 2014, while 11 countries flared less. The five countries that increased flaring flaring the most between 2014 and 2021 were Syria (up by 168 per cent) Libya (up 107 per cent), Argentina (up 68 per cent), Iran (up 42 per cent), and Russia (up 39 per cent).
8.
Reductions in gas flaring in Canada
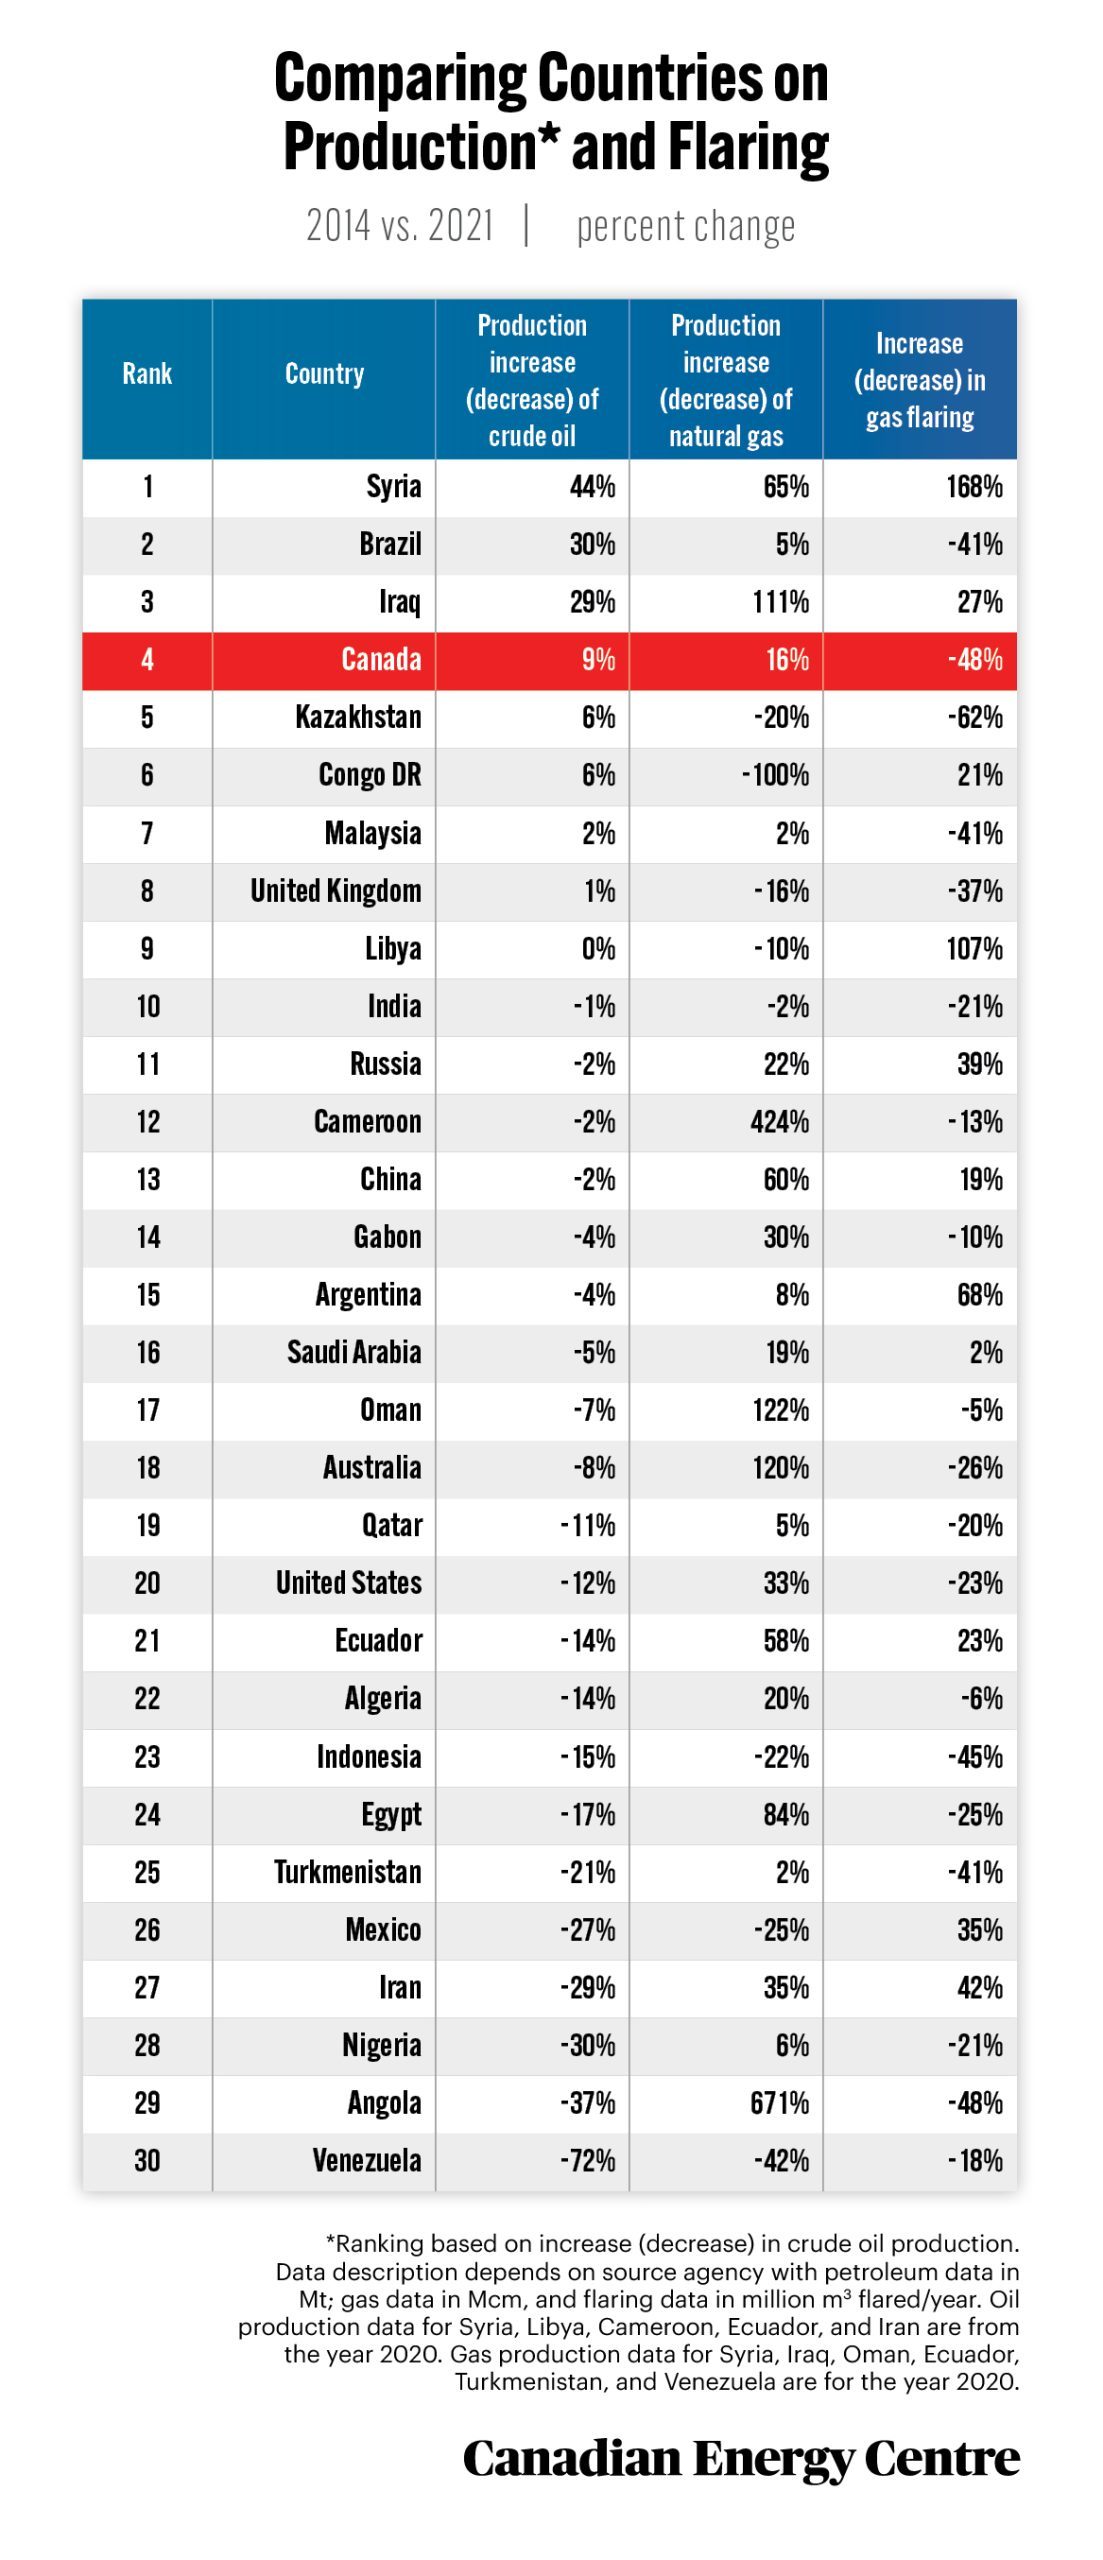
There was a 48 per cent reduction in emissions from oil and gas flaring in Canada between 2014 and 2021, even as Canada’s production of crude oil increased by nine per cent and natural gas production rose by 16 per cent in that period.
9.
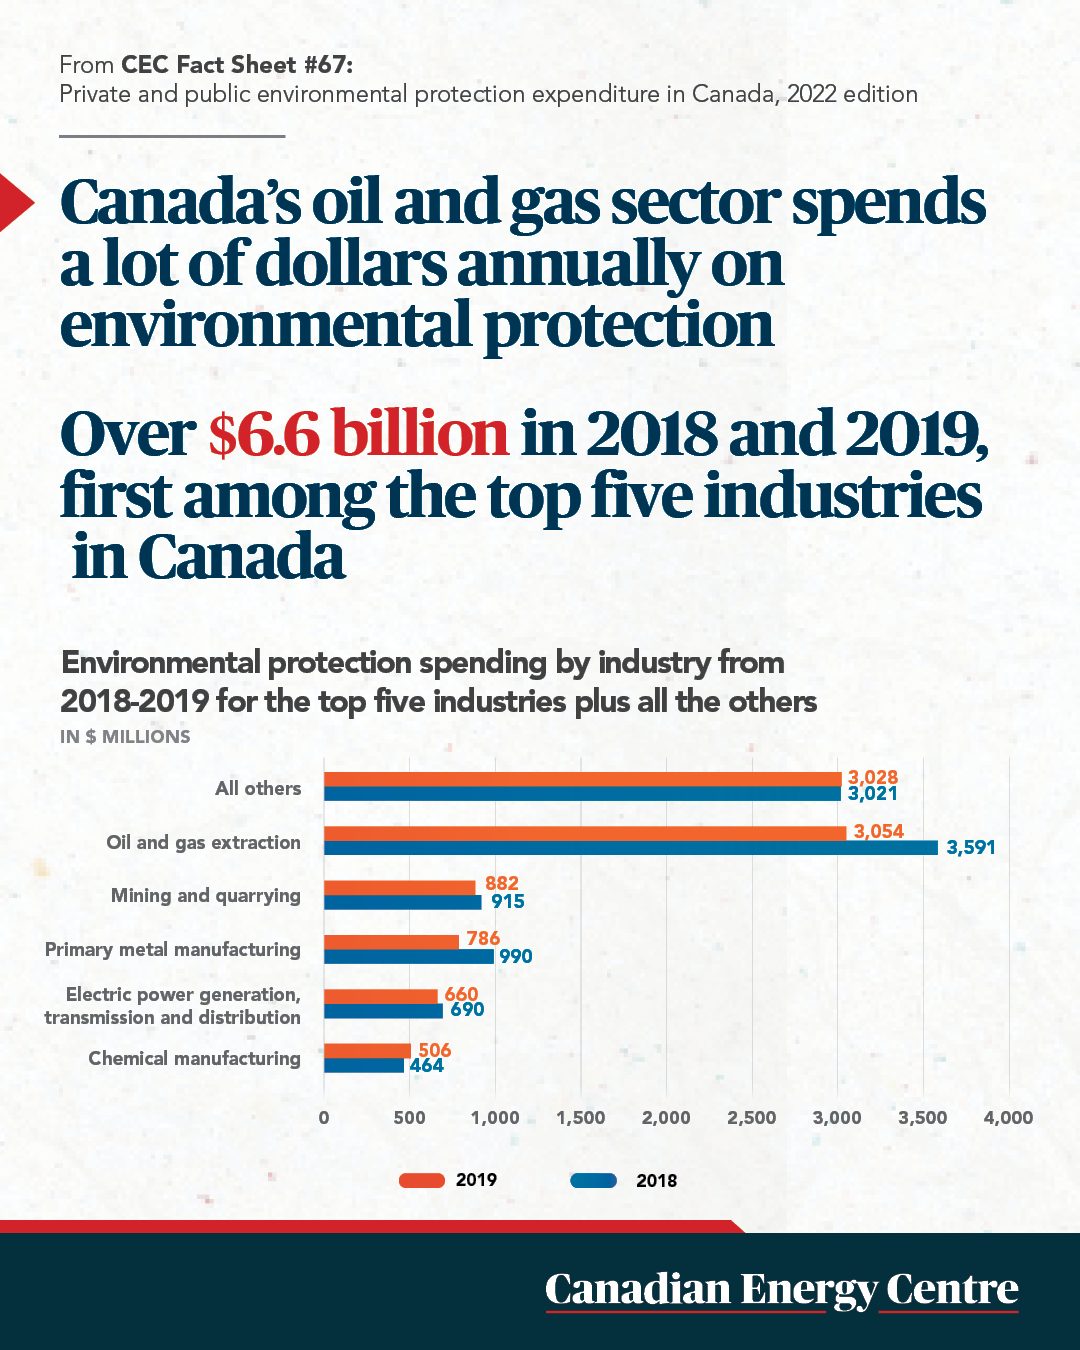
Environmental spending by Canada’s oil and gas sector
In 2018 and 2019, the oil and gas sector spent $6.6 billion over both years, while all other industries combined spent $11.9 billion. Between 2006 and 2018, the oil and gas sector alone spent $28.1 billion or 41 per cent in capital and operating expenses on environmental protection, while all other industries combined spent $39.6 billion or 59 per cent.
10.
Provincial spending on environmental protection
Of the $128.8 billion that provinces spent on environmental protection between 2008 and 2020, Alberta spent $21.4 billion or 16.6 per cent of the total, while its proportion of the (10-province) population was 11.7 per cent as of 2020.
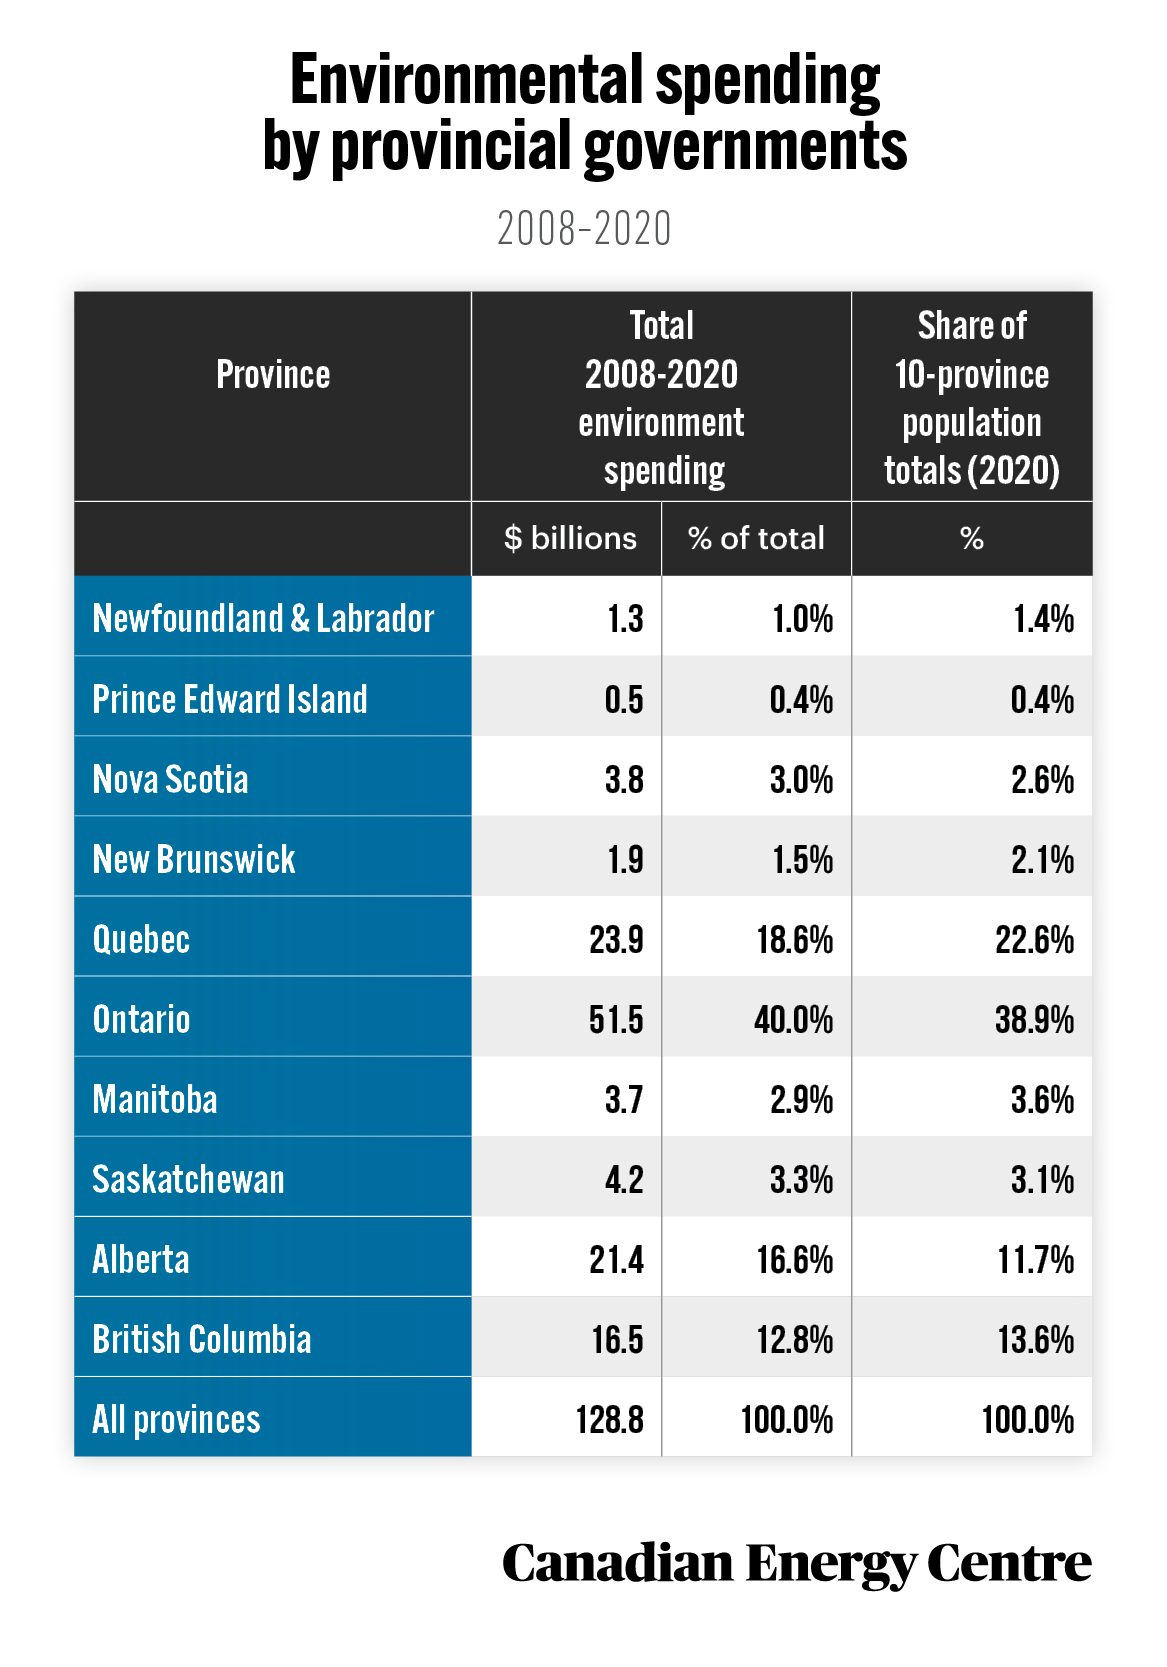
Source: Statistics Canada, Tables 10-10-0005-01 and 17-10-0005-01; and authors’ calculations.
11.
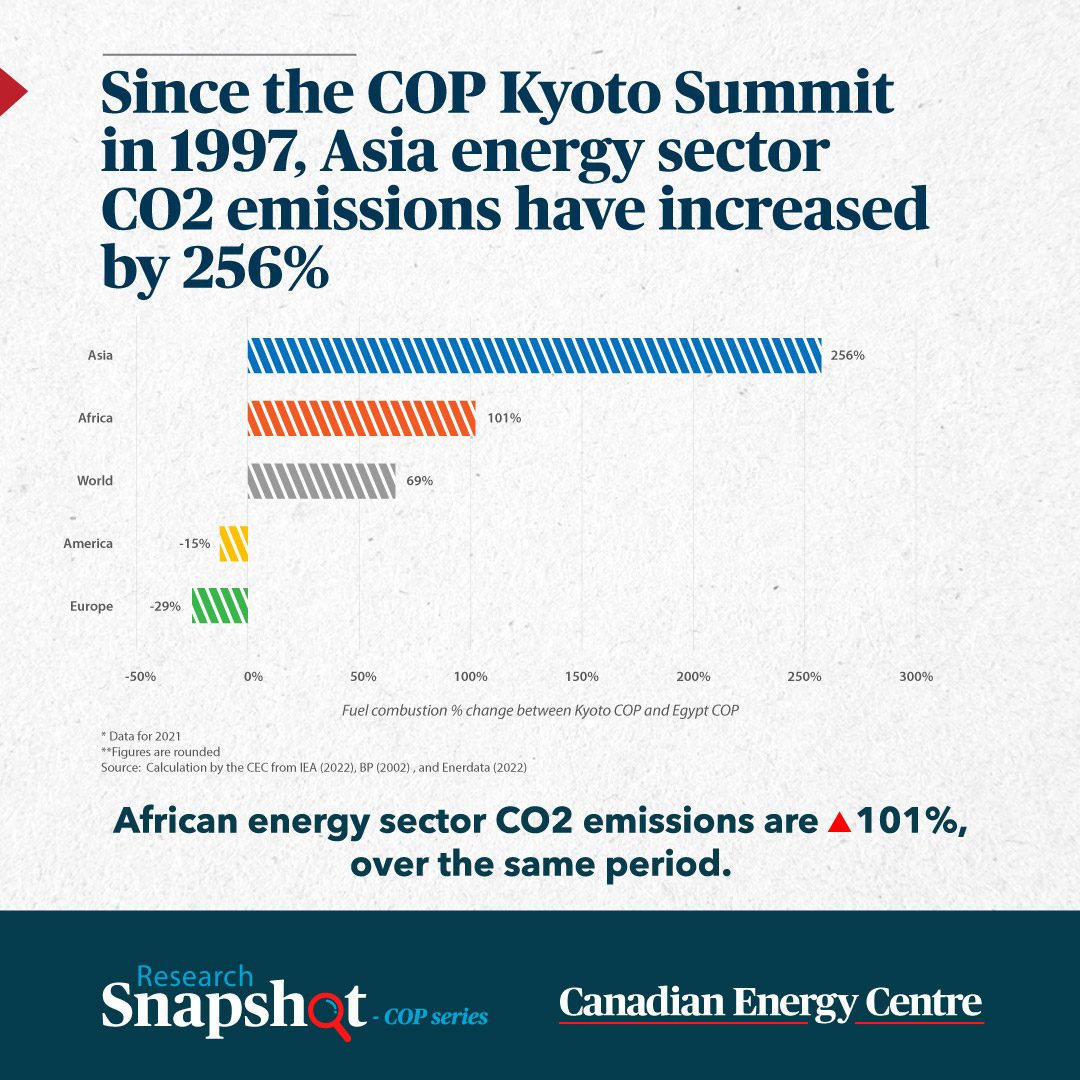
CO2 (fuel combustion) emissions in North America‘s energy sector
Since the Kyoto protocol in 1997, CO2 emissions in North America’s energy sector have decreased by 15 per cent, while massive population growth and reliance on coal have seen emissions from Asia’s energy sector emissions skyrocket by 256 per cent over the last 25 years.
Net Zero Emissions (NZE) and the Impact on Canada’s Oil and Gas Sector
12.
Impact of net zero on production by Canada’s oil and gas sector
Under a net zero scenario, which maintains the federal government’s announced emissions policy to 2030 then phases in a cap on oil and gas emissions from 2035 onwards to reach net zero emissions by 2050, Canada’s crude oil production is expected to be 508,000 barrels per day lower in 2030 and 2.054 million barrels per day lower in 2050 than under current policy. Oil sands production is anticipated to be 344,000 barrels per day lower in 2030 and 1.705 million barrels per day lower in 2050 under net zero 50/50 than under current policy. Natural gas production will be two billion cubic feet per day (bcf/d) lower in 2030 and six bcf/d lower in 2050 under net zero 50/50 than under current policy.
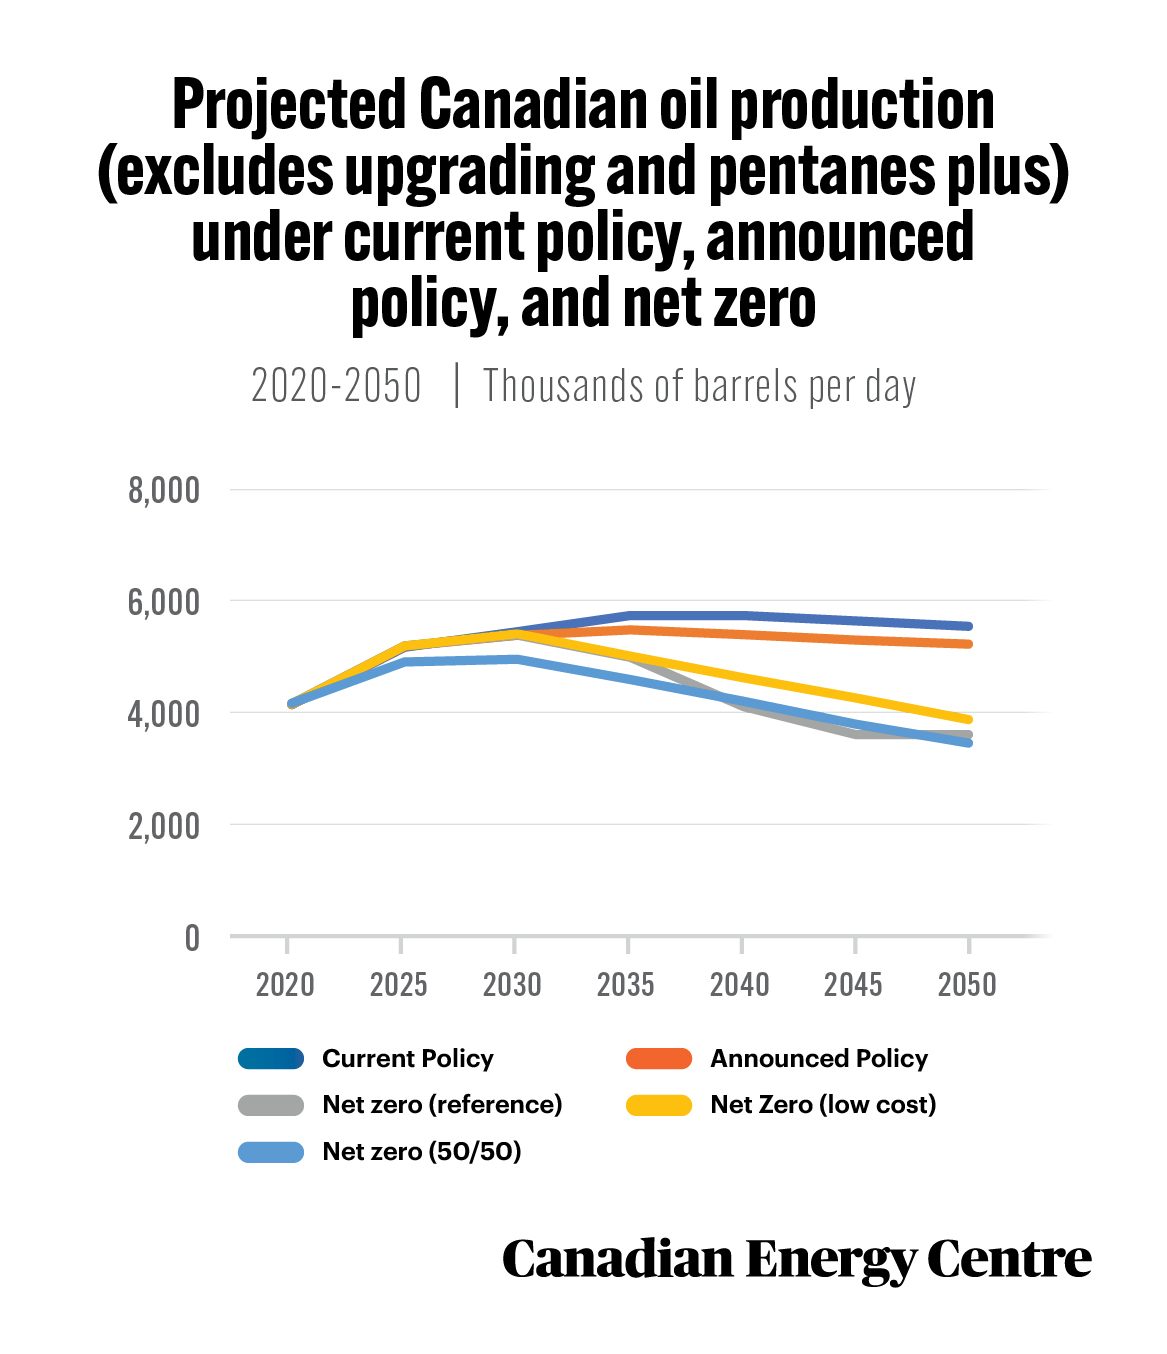
Source: Derived from the Navius Research gTech model.
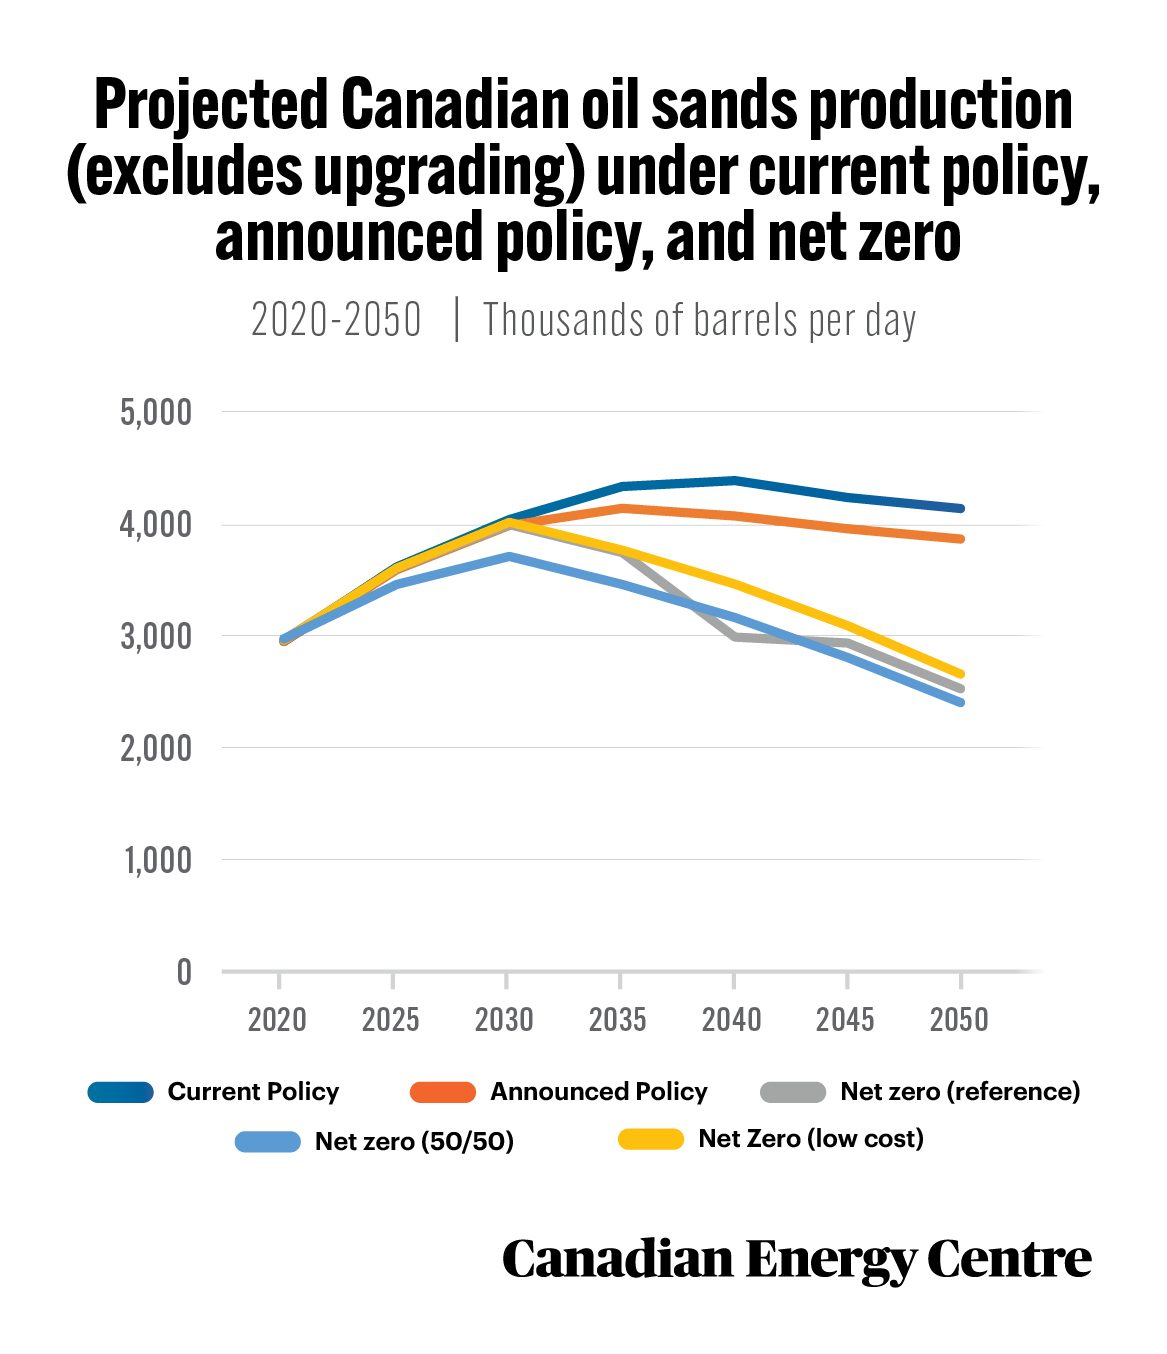
Source: Derived from the Navius Research gTech model.
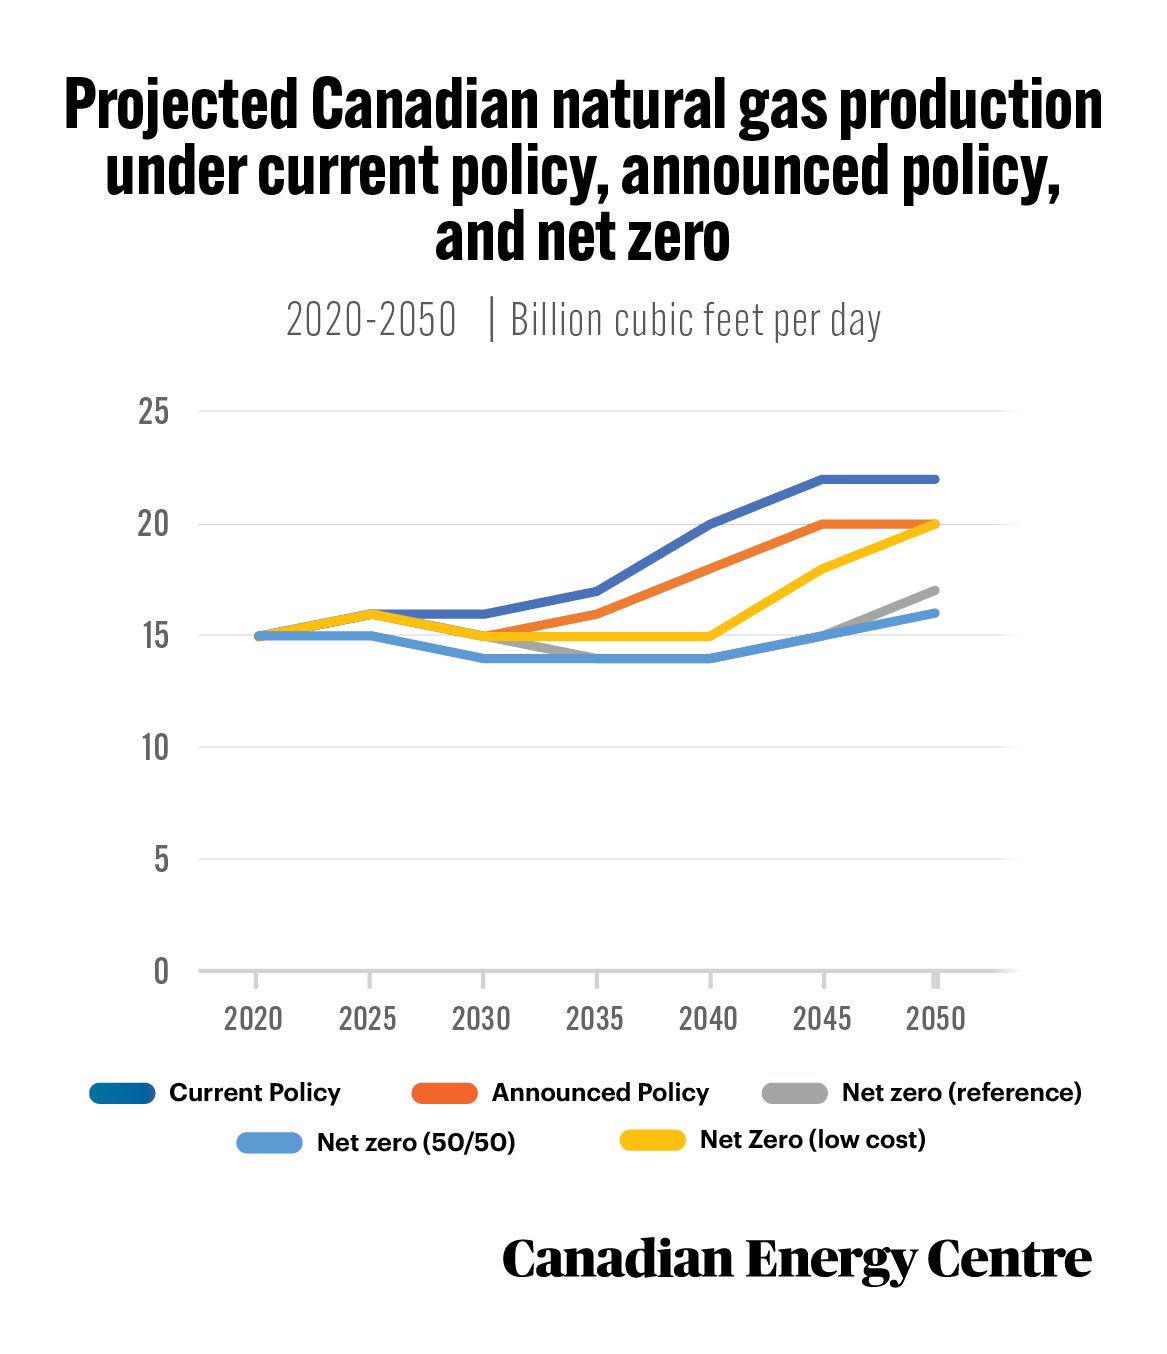
Source: Derived from the Navius Research gTech model.
13.
Impact of net zero emissions on GDP from Canada’s oil and gas sector
GDP from Canada’s oil and gas sector is expected to be $18 billion or 13.1 per cent lower in 2030 under net zero than under current policy, while in 2050, oil and gas GDP will be $65 billion or 38.7 per cent lower under net zero than under current policy. GDP from the oil sands sector is projected to be $5 billion or 10.2 per cent lower in 2030 under net zero than under current policy, while in 2050, GDP from the oil sands sector will be $32 billion or 65.3 per cent lower under net zero than under current policy.
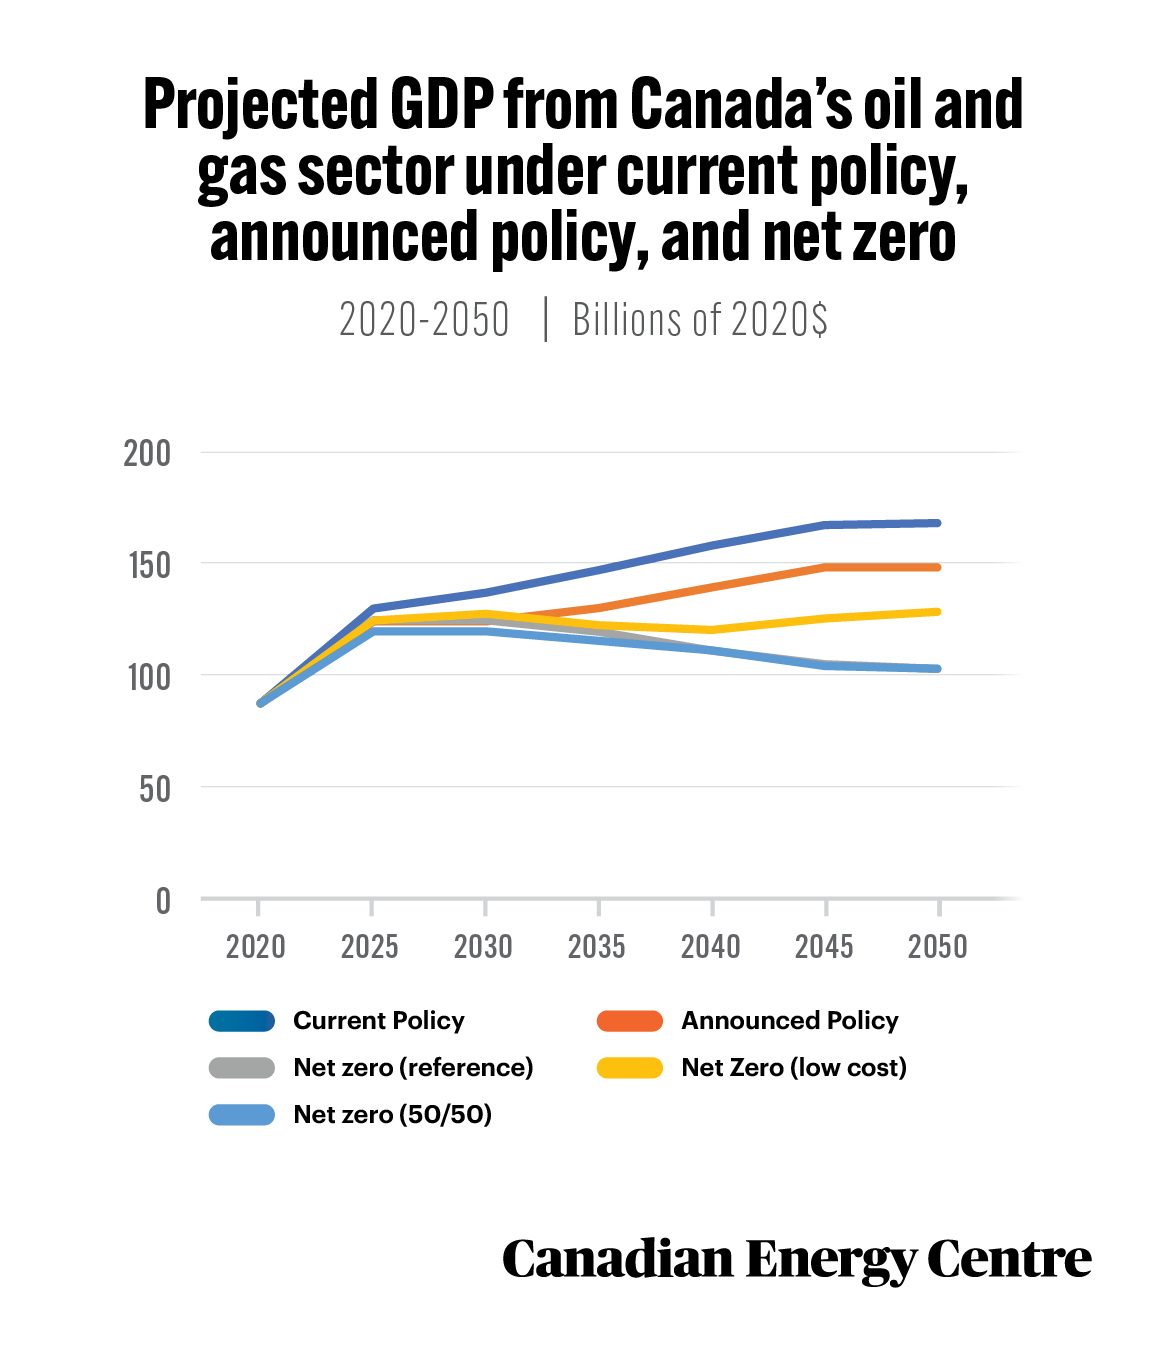
Source: Derived from the Navius Research gTech model.
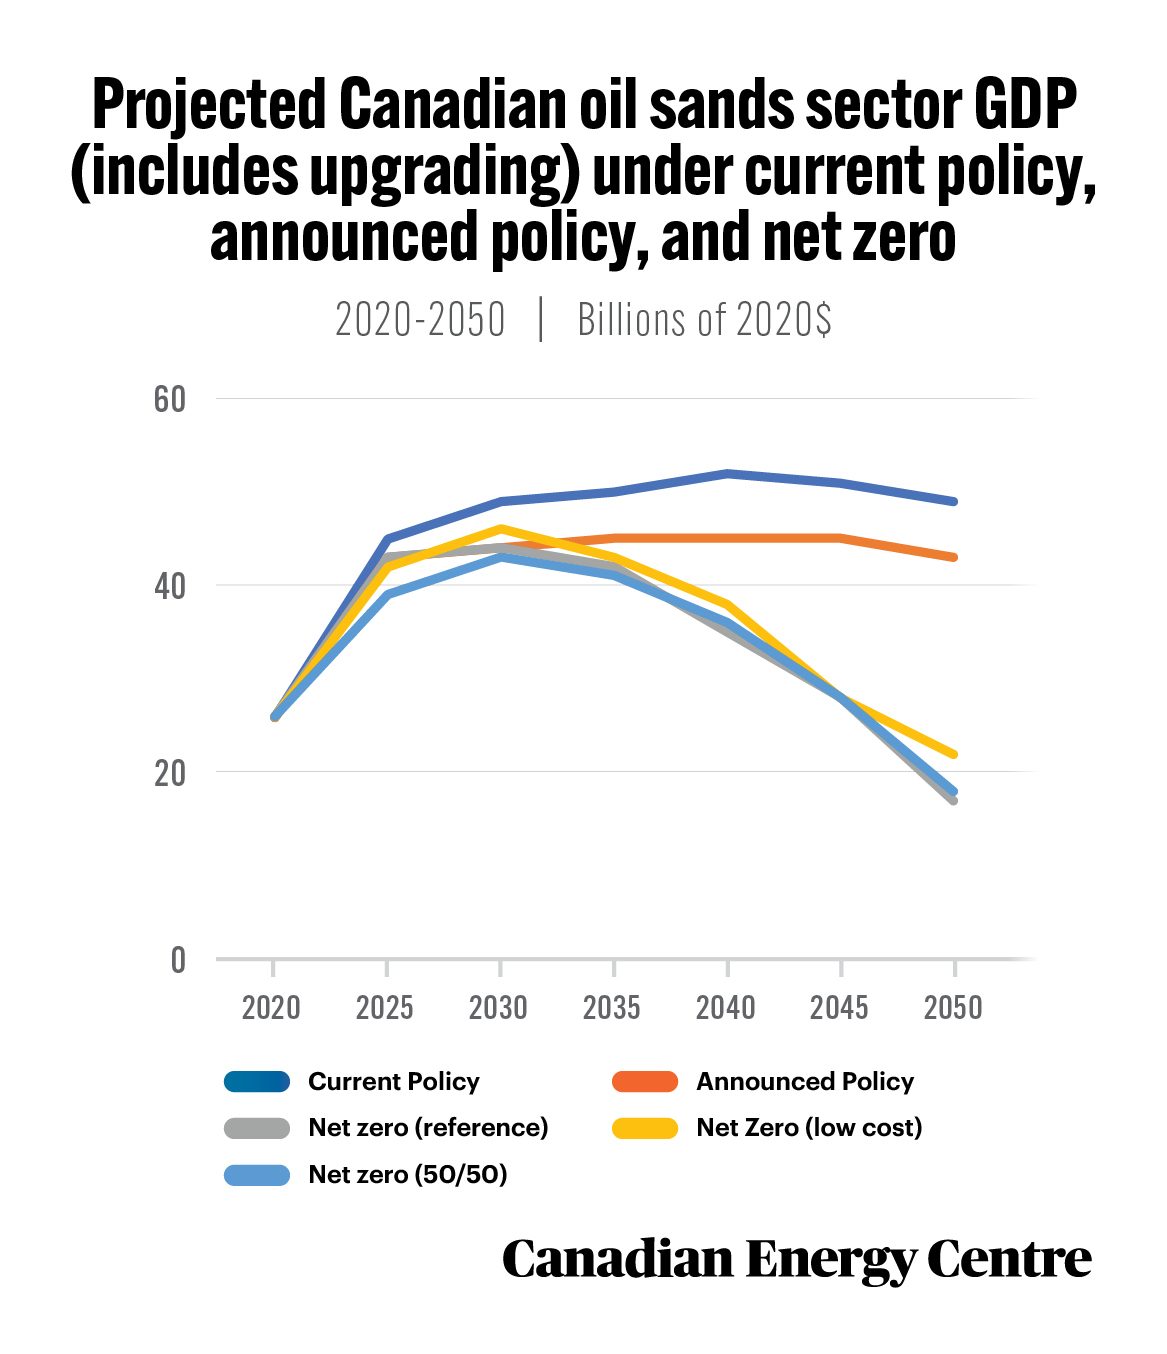
Source: Derived from the Navius Research gTech model.
14.
Net zero transition risk for Canada’s upstream oil and gas sector
Cumulatively between 2022 and 2050, US$1.6 trillion of revenue for the government from Canada’s upstream oil and gas sector is at risk under a net zero scenario. And, cumulatively between 2022 and 2050, US$503.4 billion of Canadian upstream oil and gas sector capex is at risk under a net zero scenario.
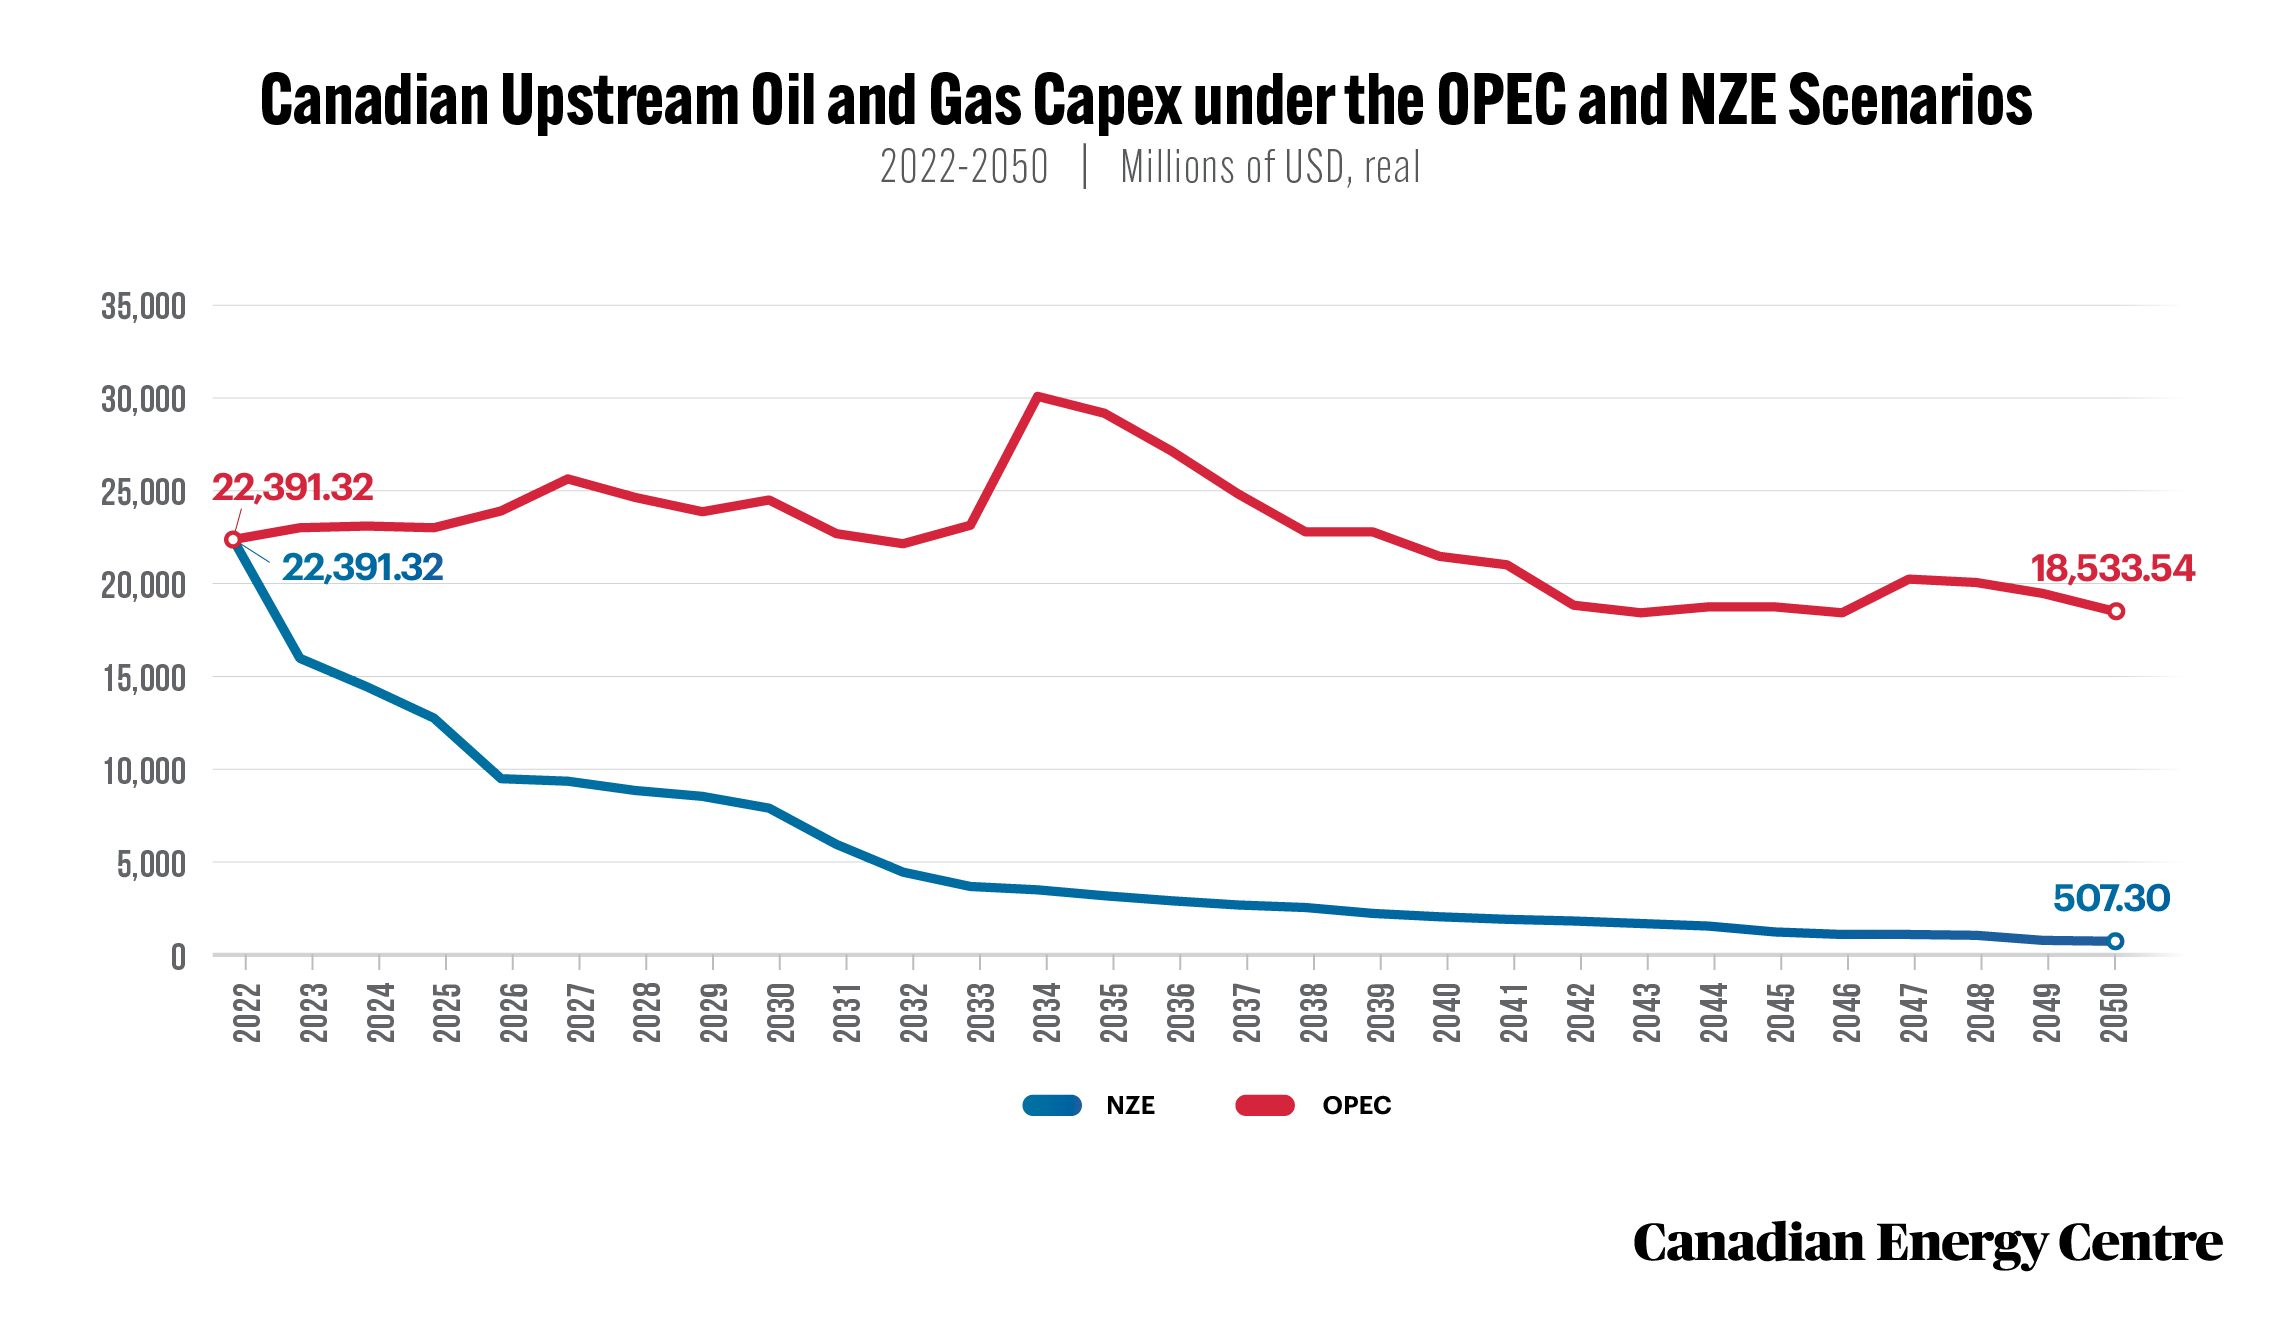
Source: Derived from the Rystad Energy Upstream Energy Transition Risk Dashboard
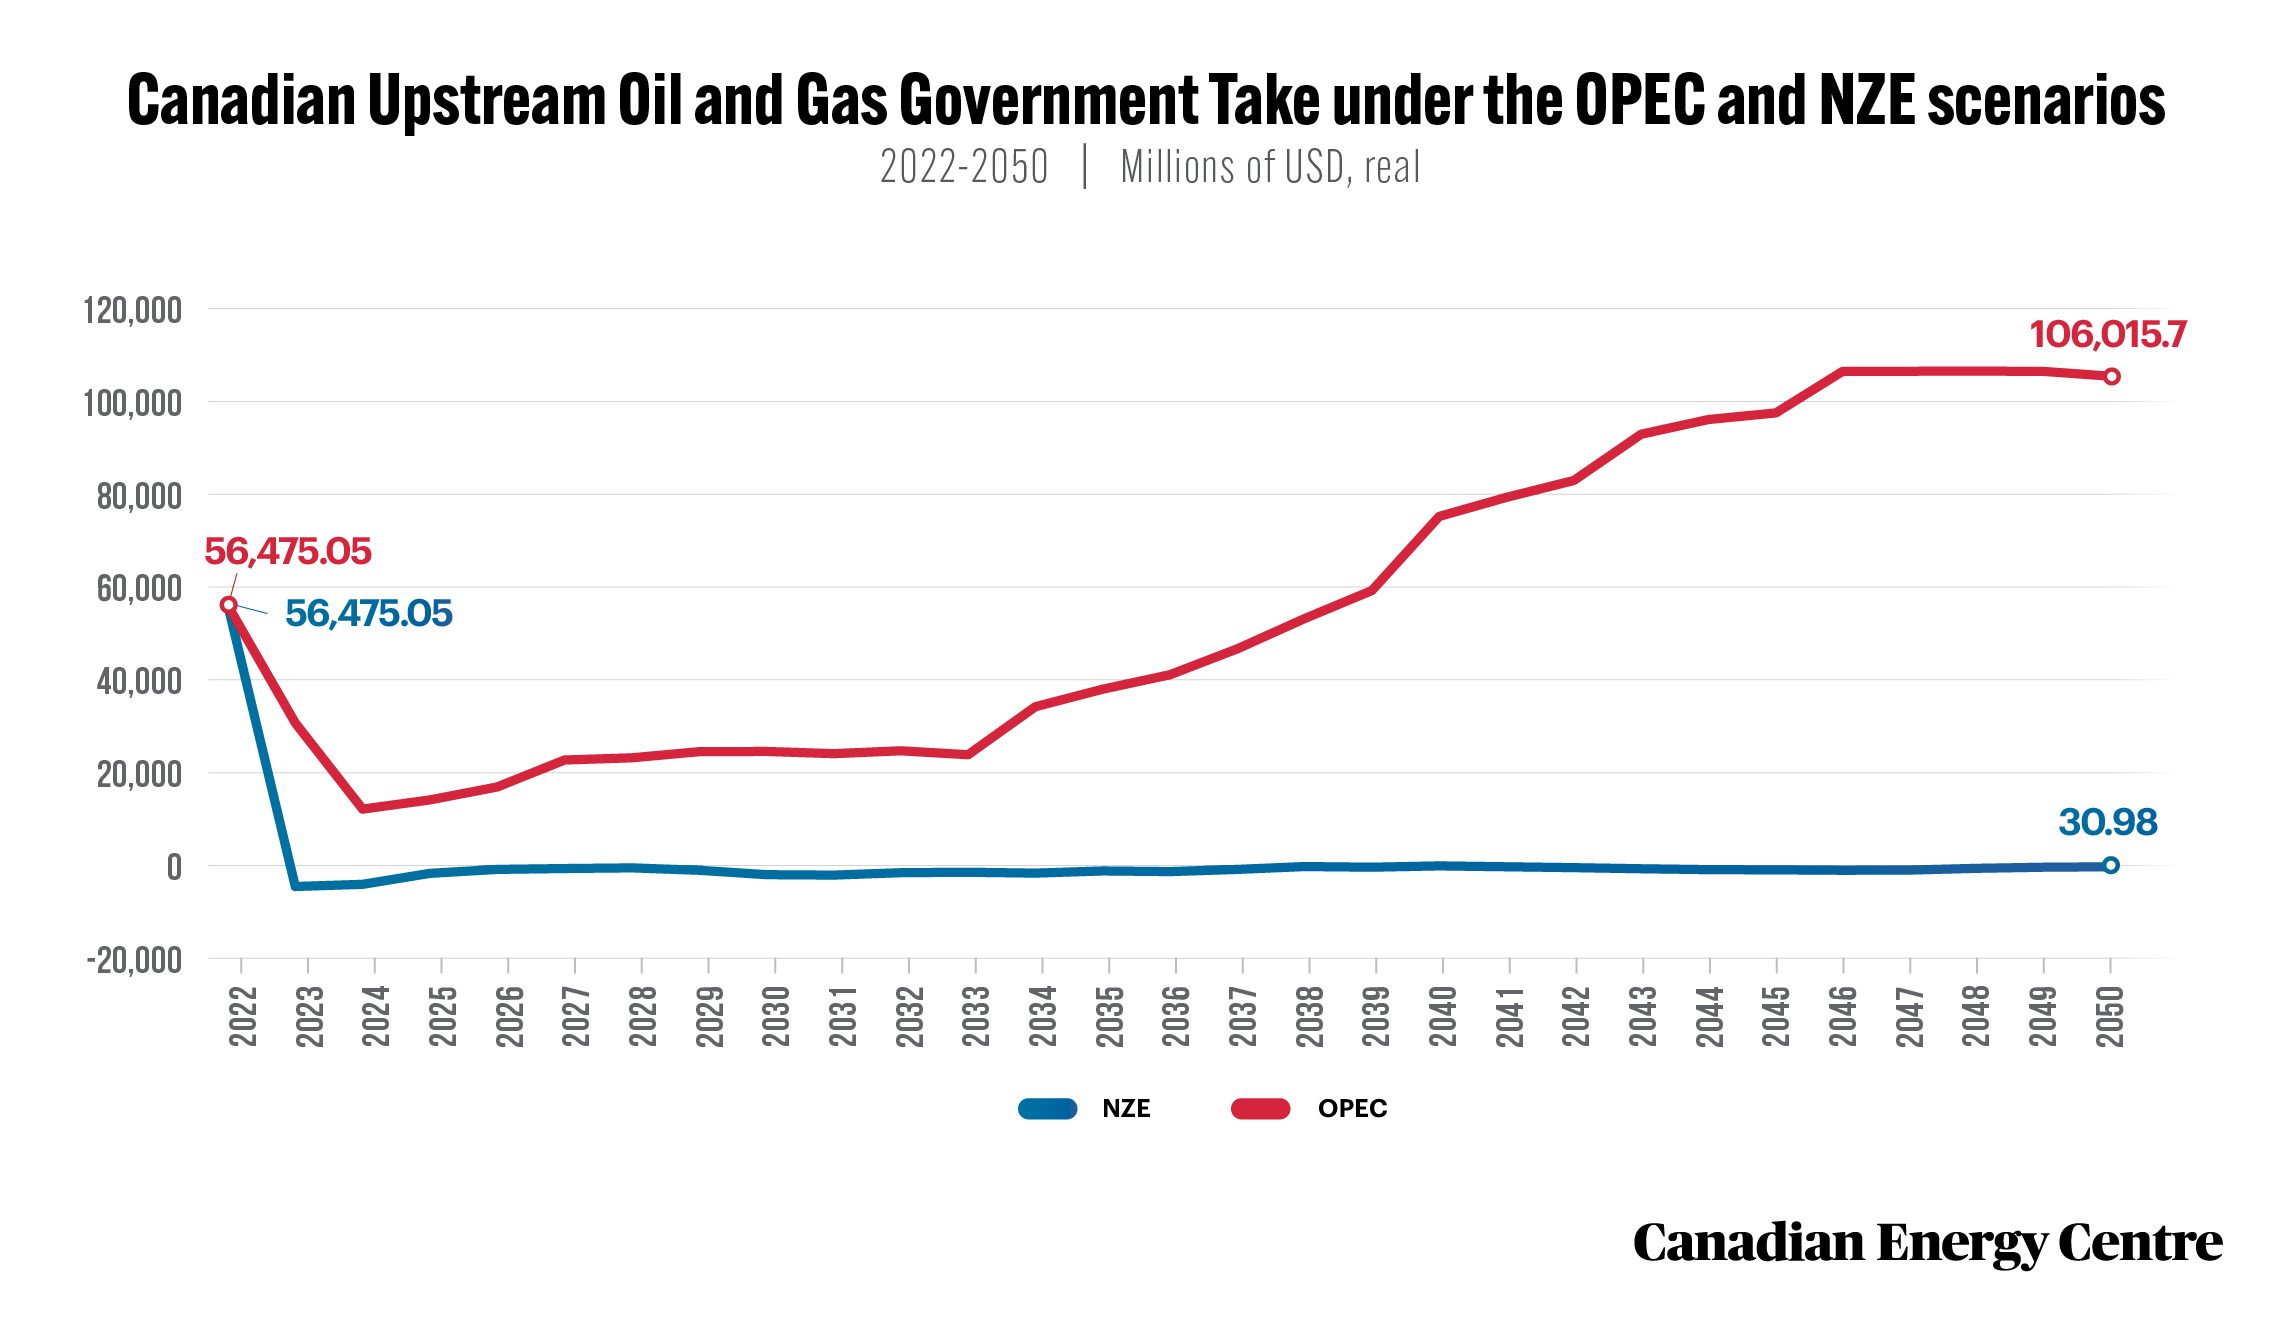
Source: Derived from the Rystad Energy Upstream Energy Transition Risk Dashboard
15.
Net zero transition risk for Canada’s oil sands sector
Cumulatively, between 2022 and 2050, $728 billion of revenue for the government from Canada’s oil sands sector is at risk under a net zero scenario.
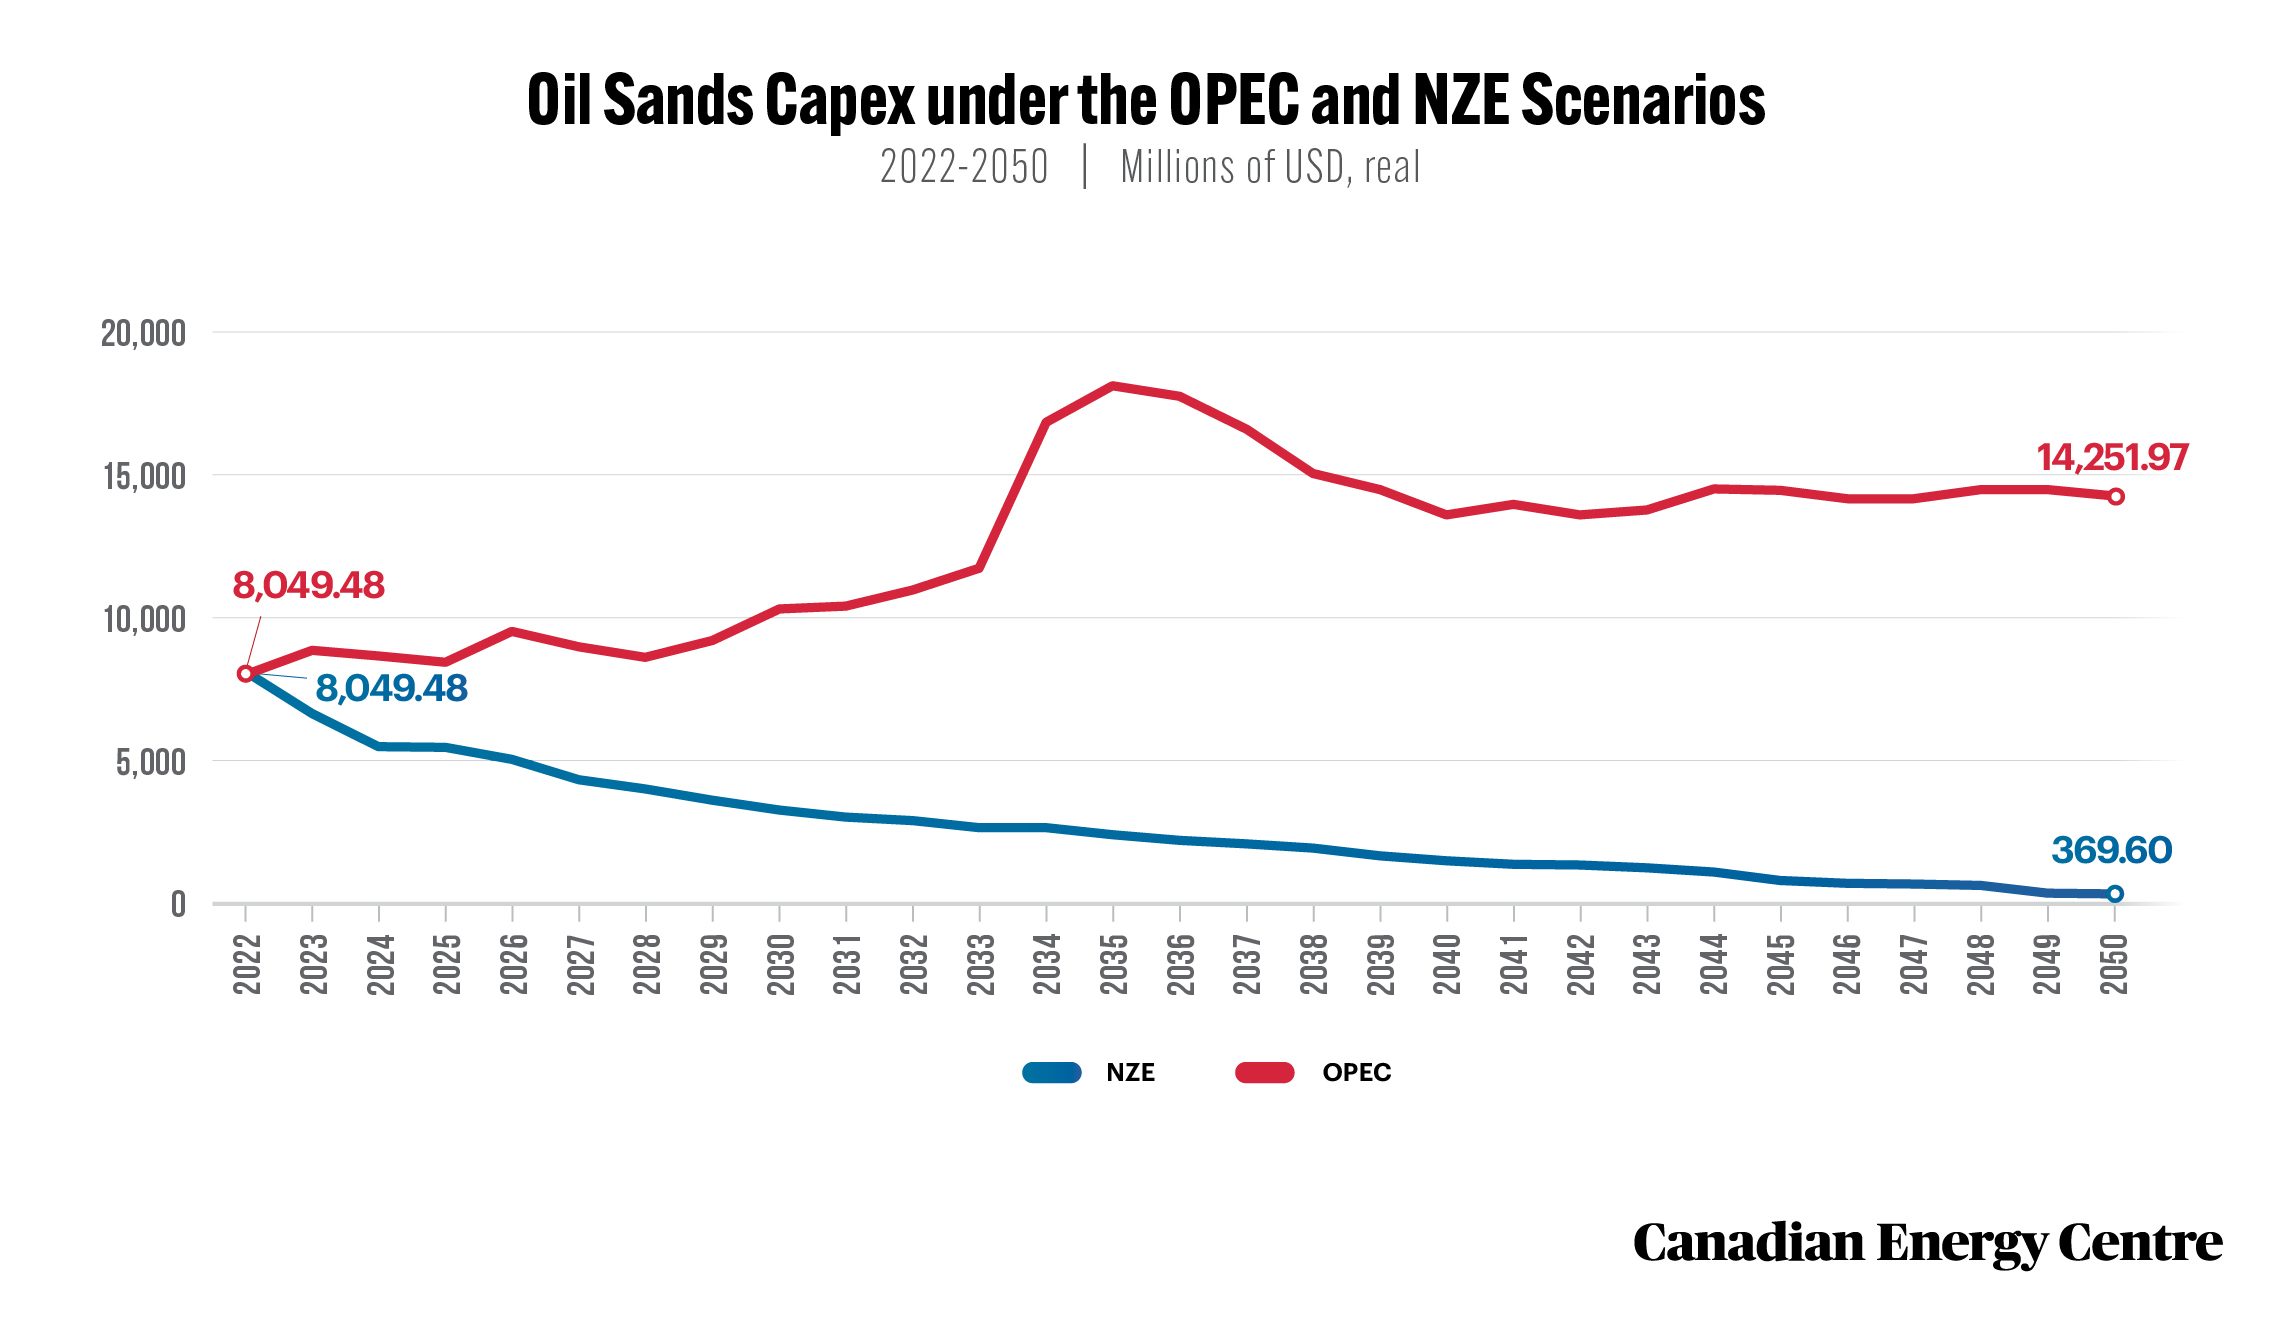
Source: Derived from the Rystad Energy Upstream Energy Transition Risk Dashboard
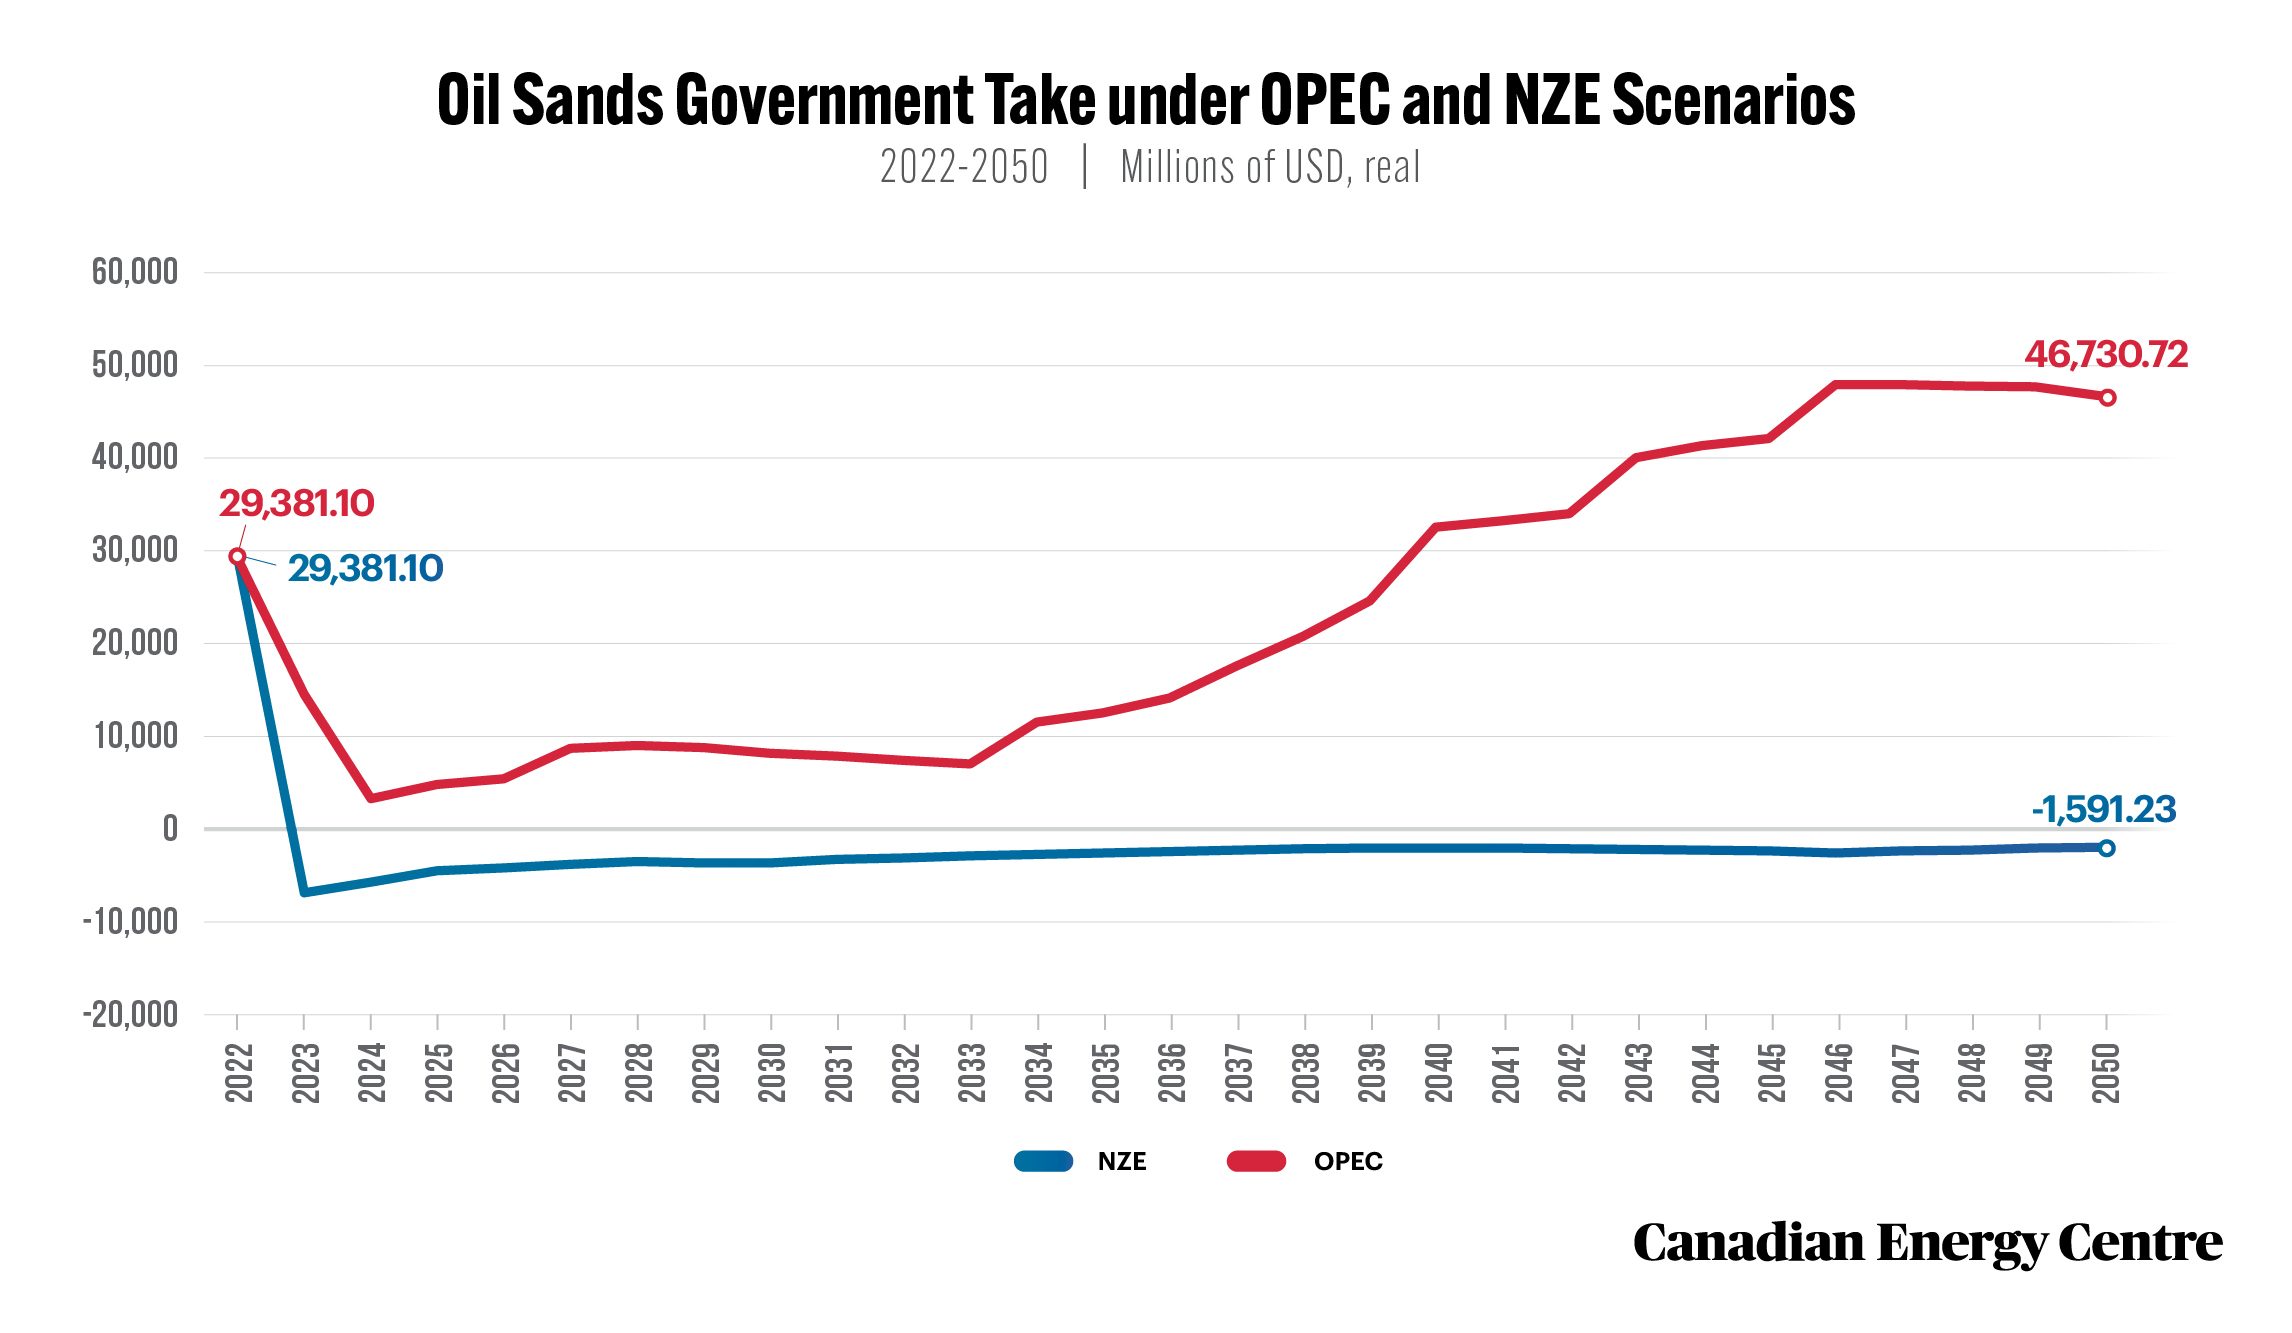
Source: Derived from the Rystad Energy Upstream Energy Transition Risk Dashboard
16.
Asssessing Canada’s natural gas markets under net zero
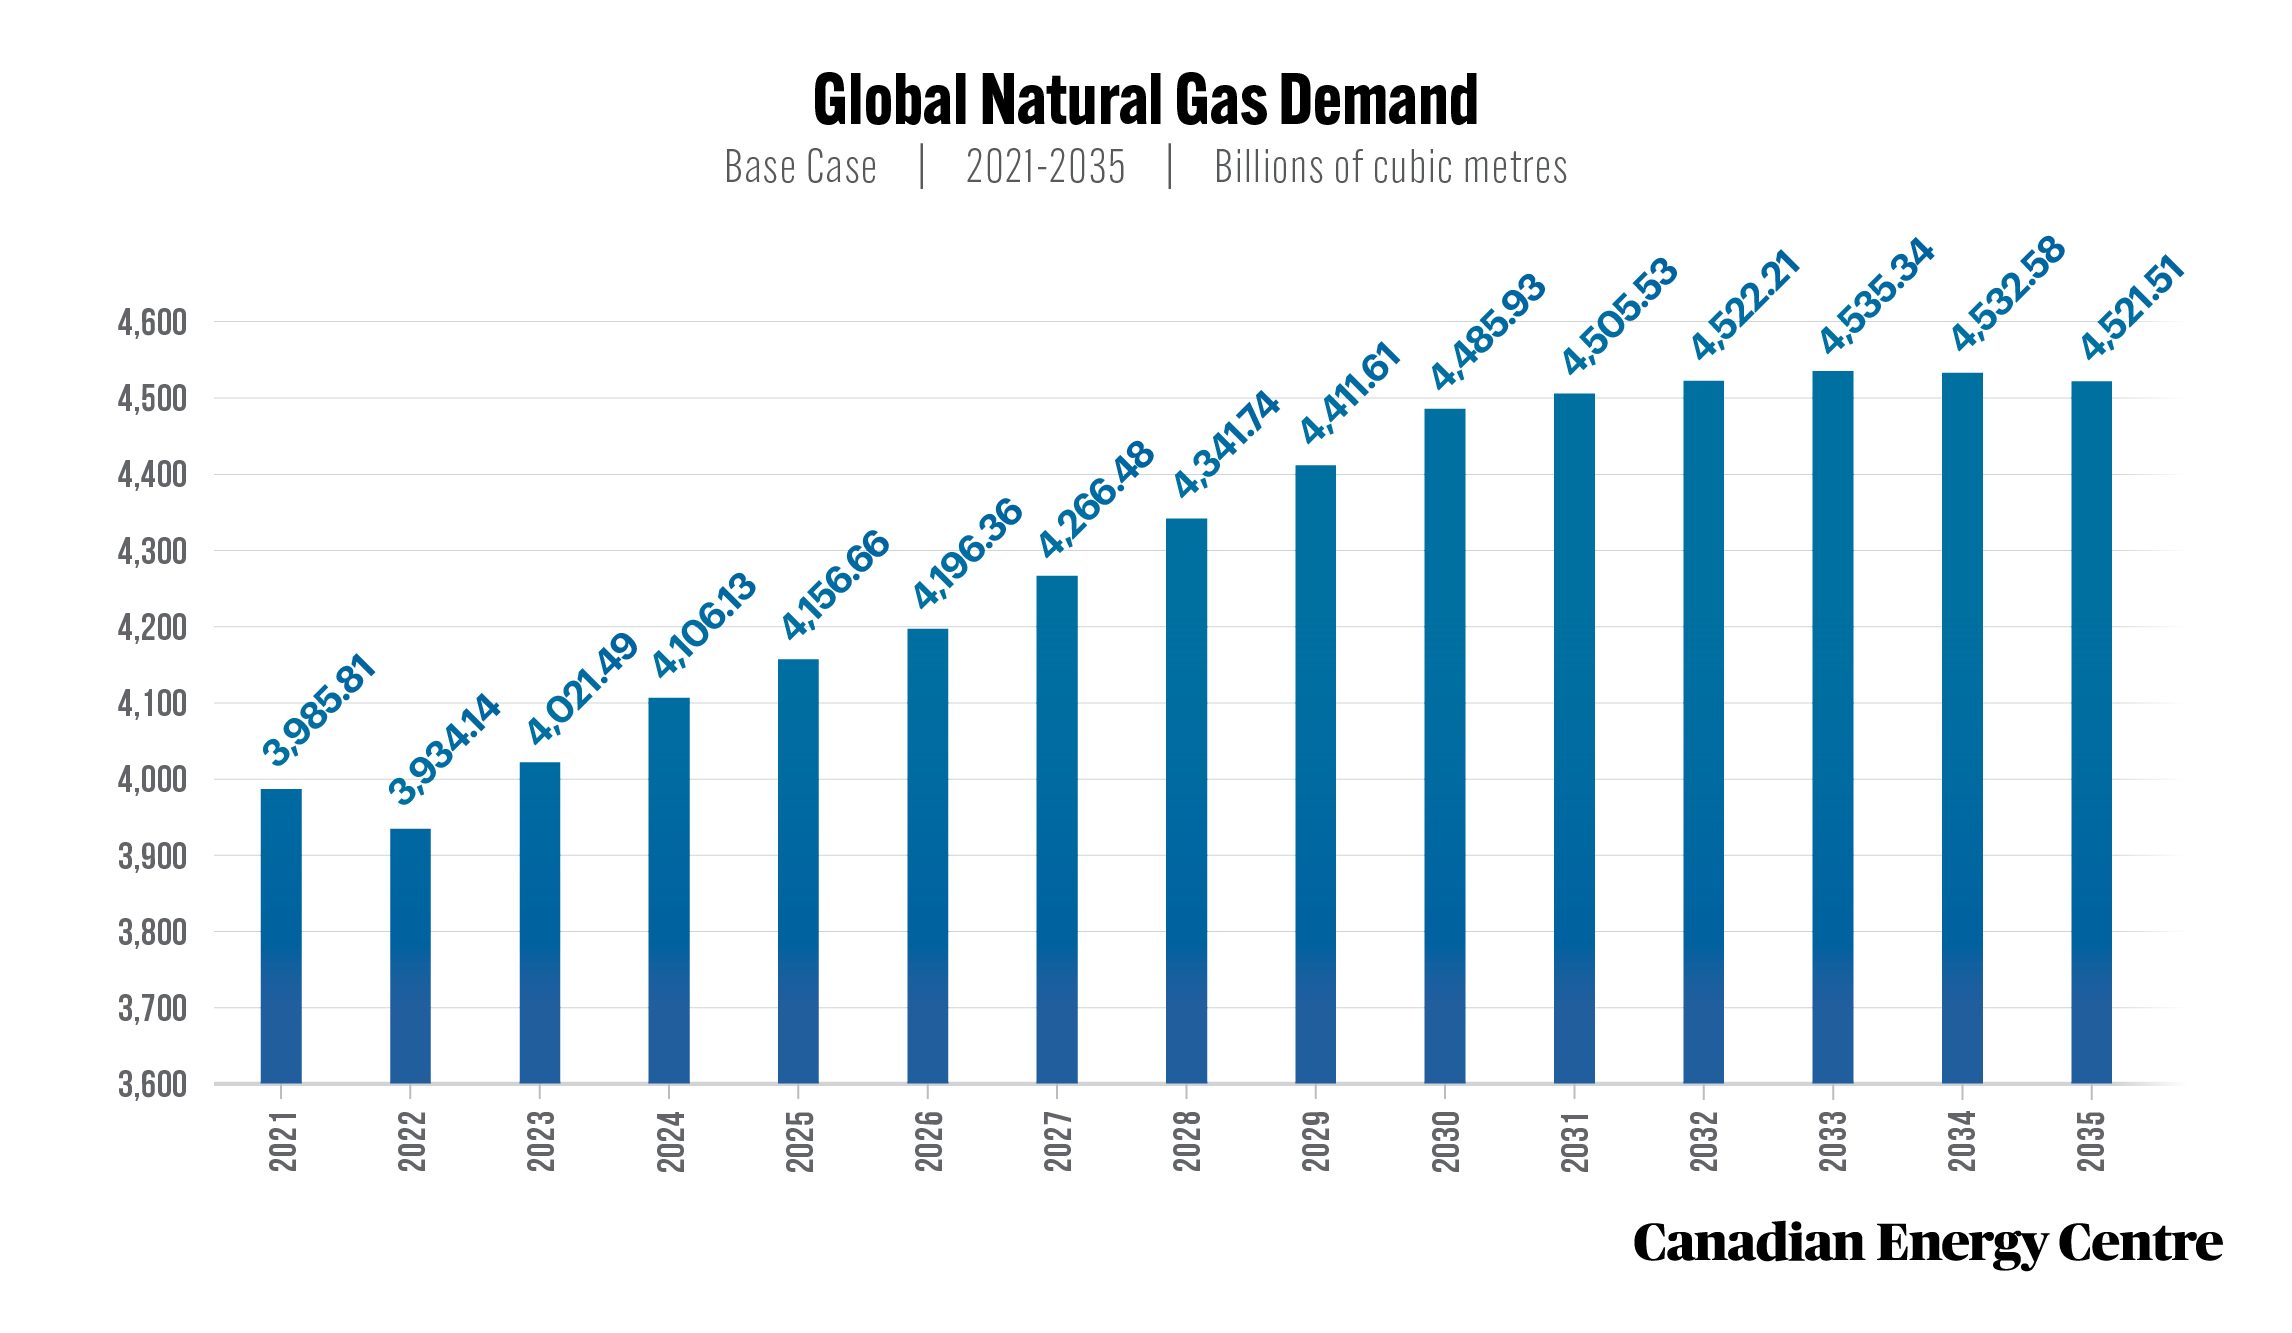
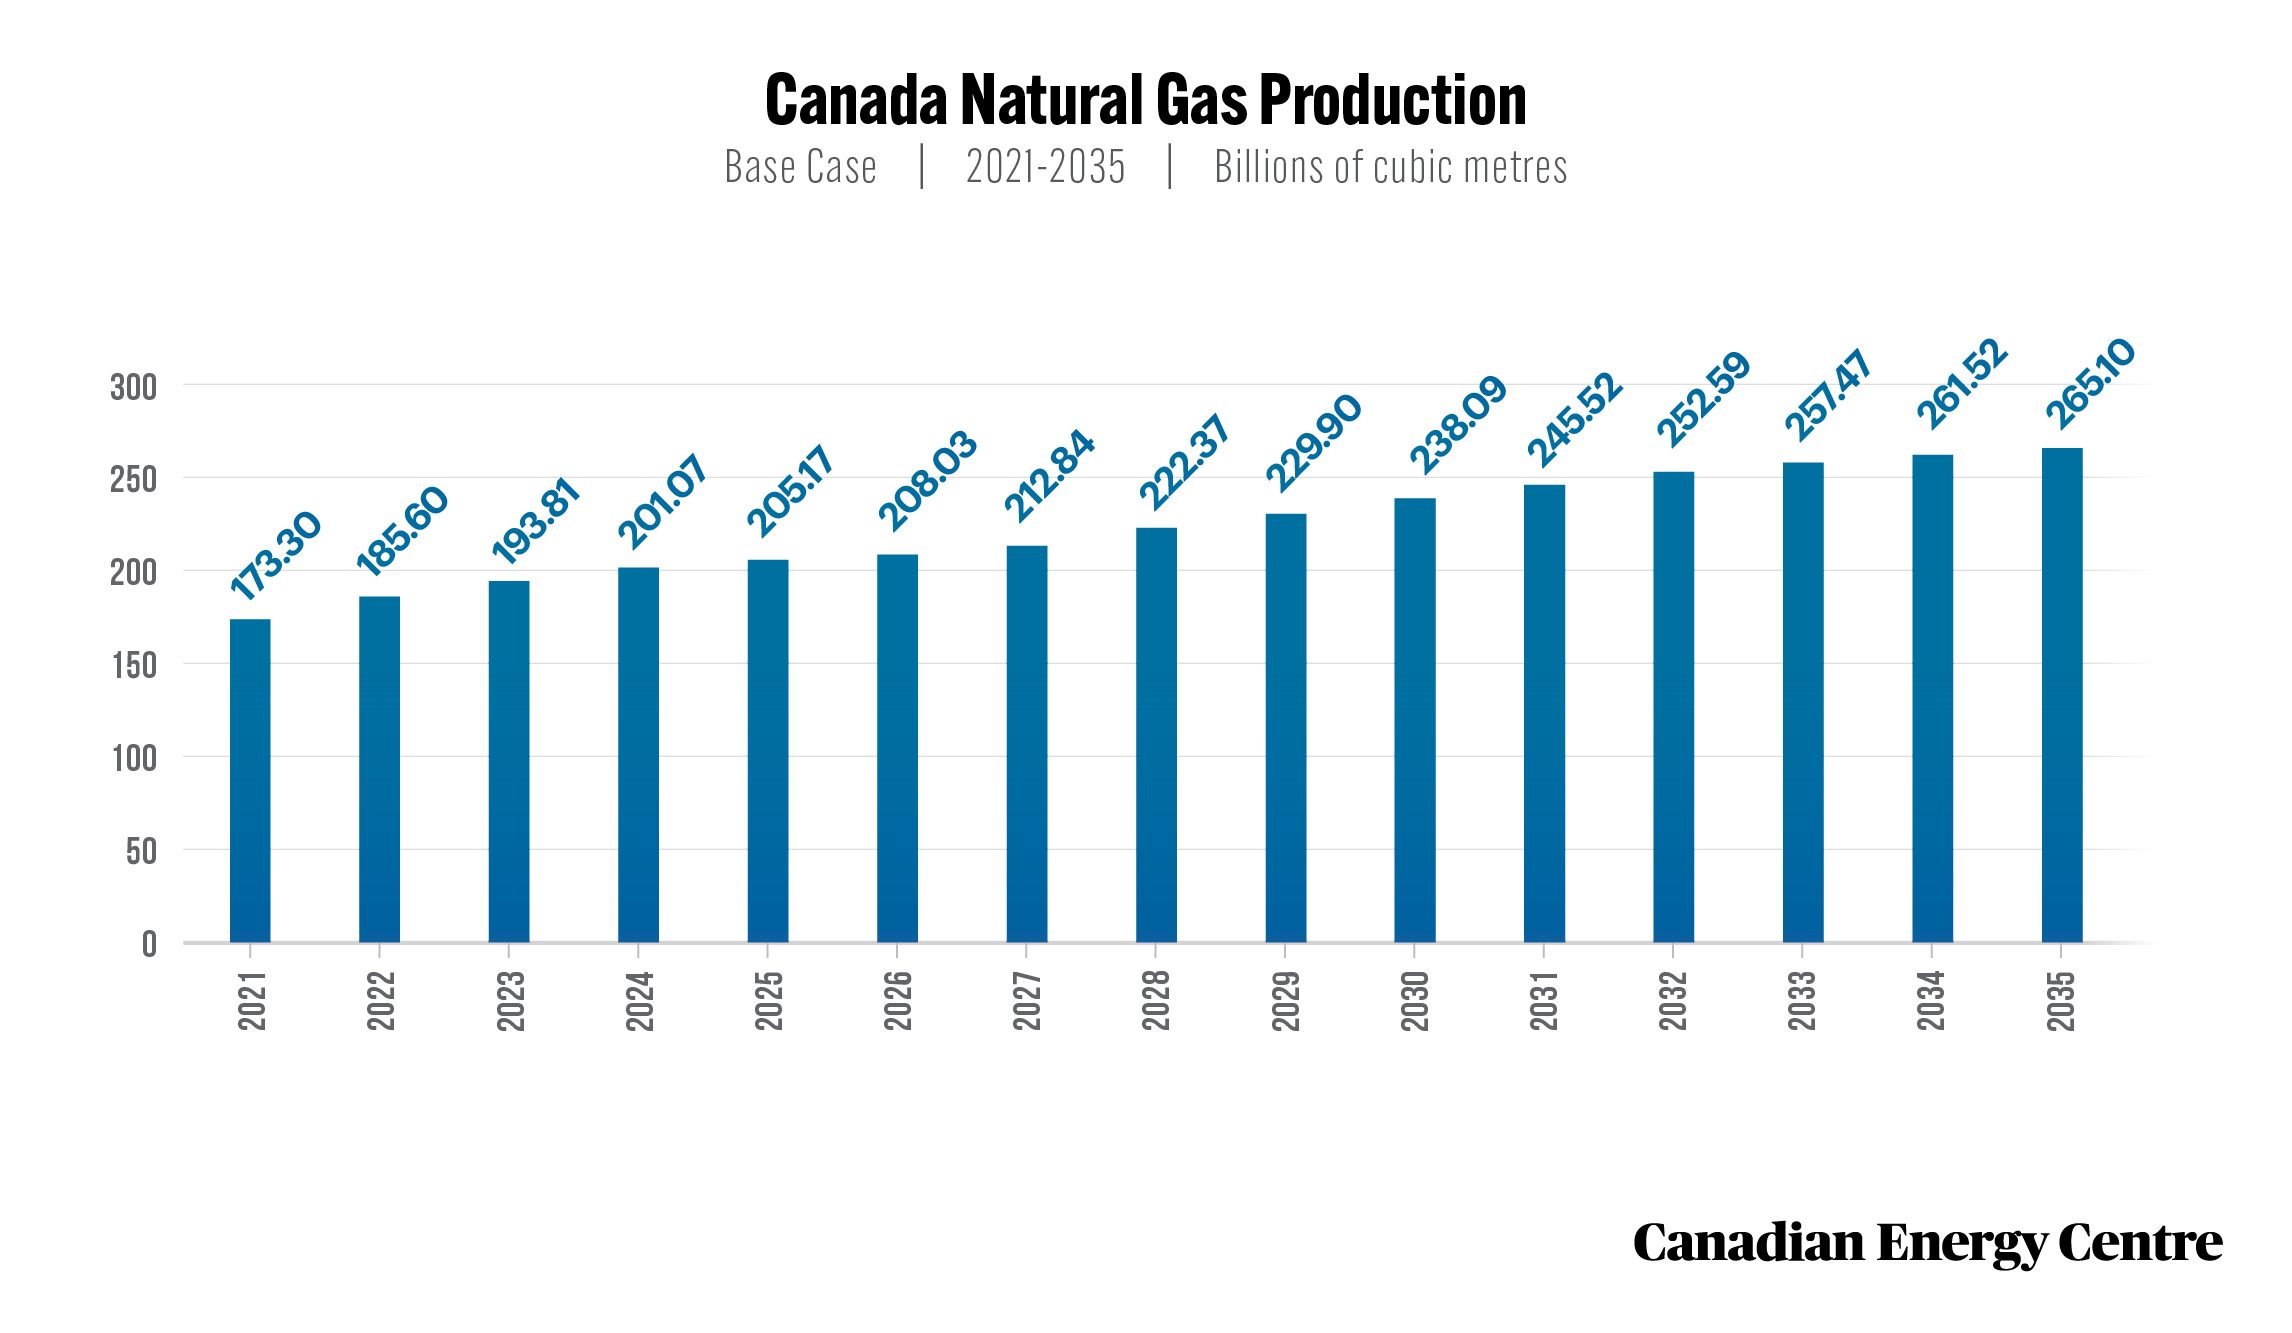
Under Rystad Energy’s supply and demand base case, global natural gas demand will increase by over 13 per cent between 2021 and 2035, growing from 3,985 billion to 4,522 billion cubic metres (bcm) per year. Under the Rystad base case, natural gas production in Canada is forecast to continue to be strong, rising from 173 bcm in 2021 to 265 bcm in 2035, an increase of nearly 48 per cent. LNG supply in Canada is expected to begin by 2025 (at 3.31 bcm per year), rising to 38.98 bcm per year by 2034, before falling slightly to 38.96 bcm by 2035, according to Rystad Energy
Source: Derived from the Rystad Energy GasMarketCube
Source: Derived from the Rystad Energy GasMarketCube
Carbon Caputure, Utilization and Storage (CCUS), Direct Air Capture, and Hydrogen
17.
Short-term impact of Carbon Capture, Utilization and Storage (CCUS) in Canada
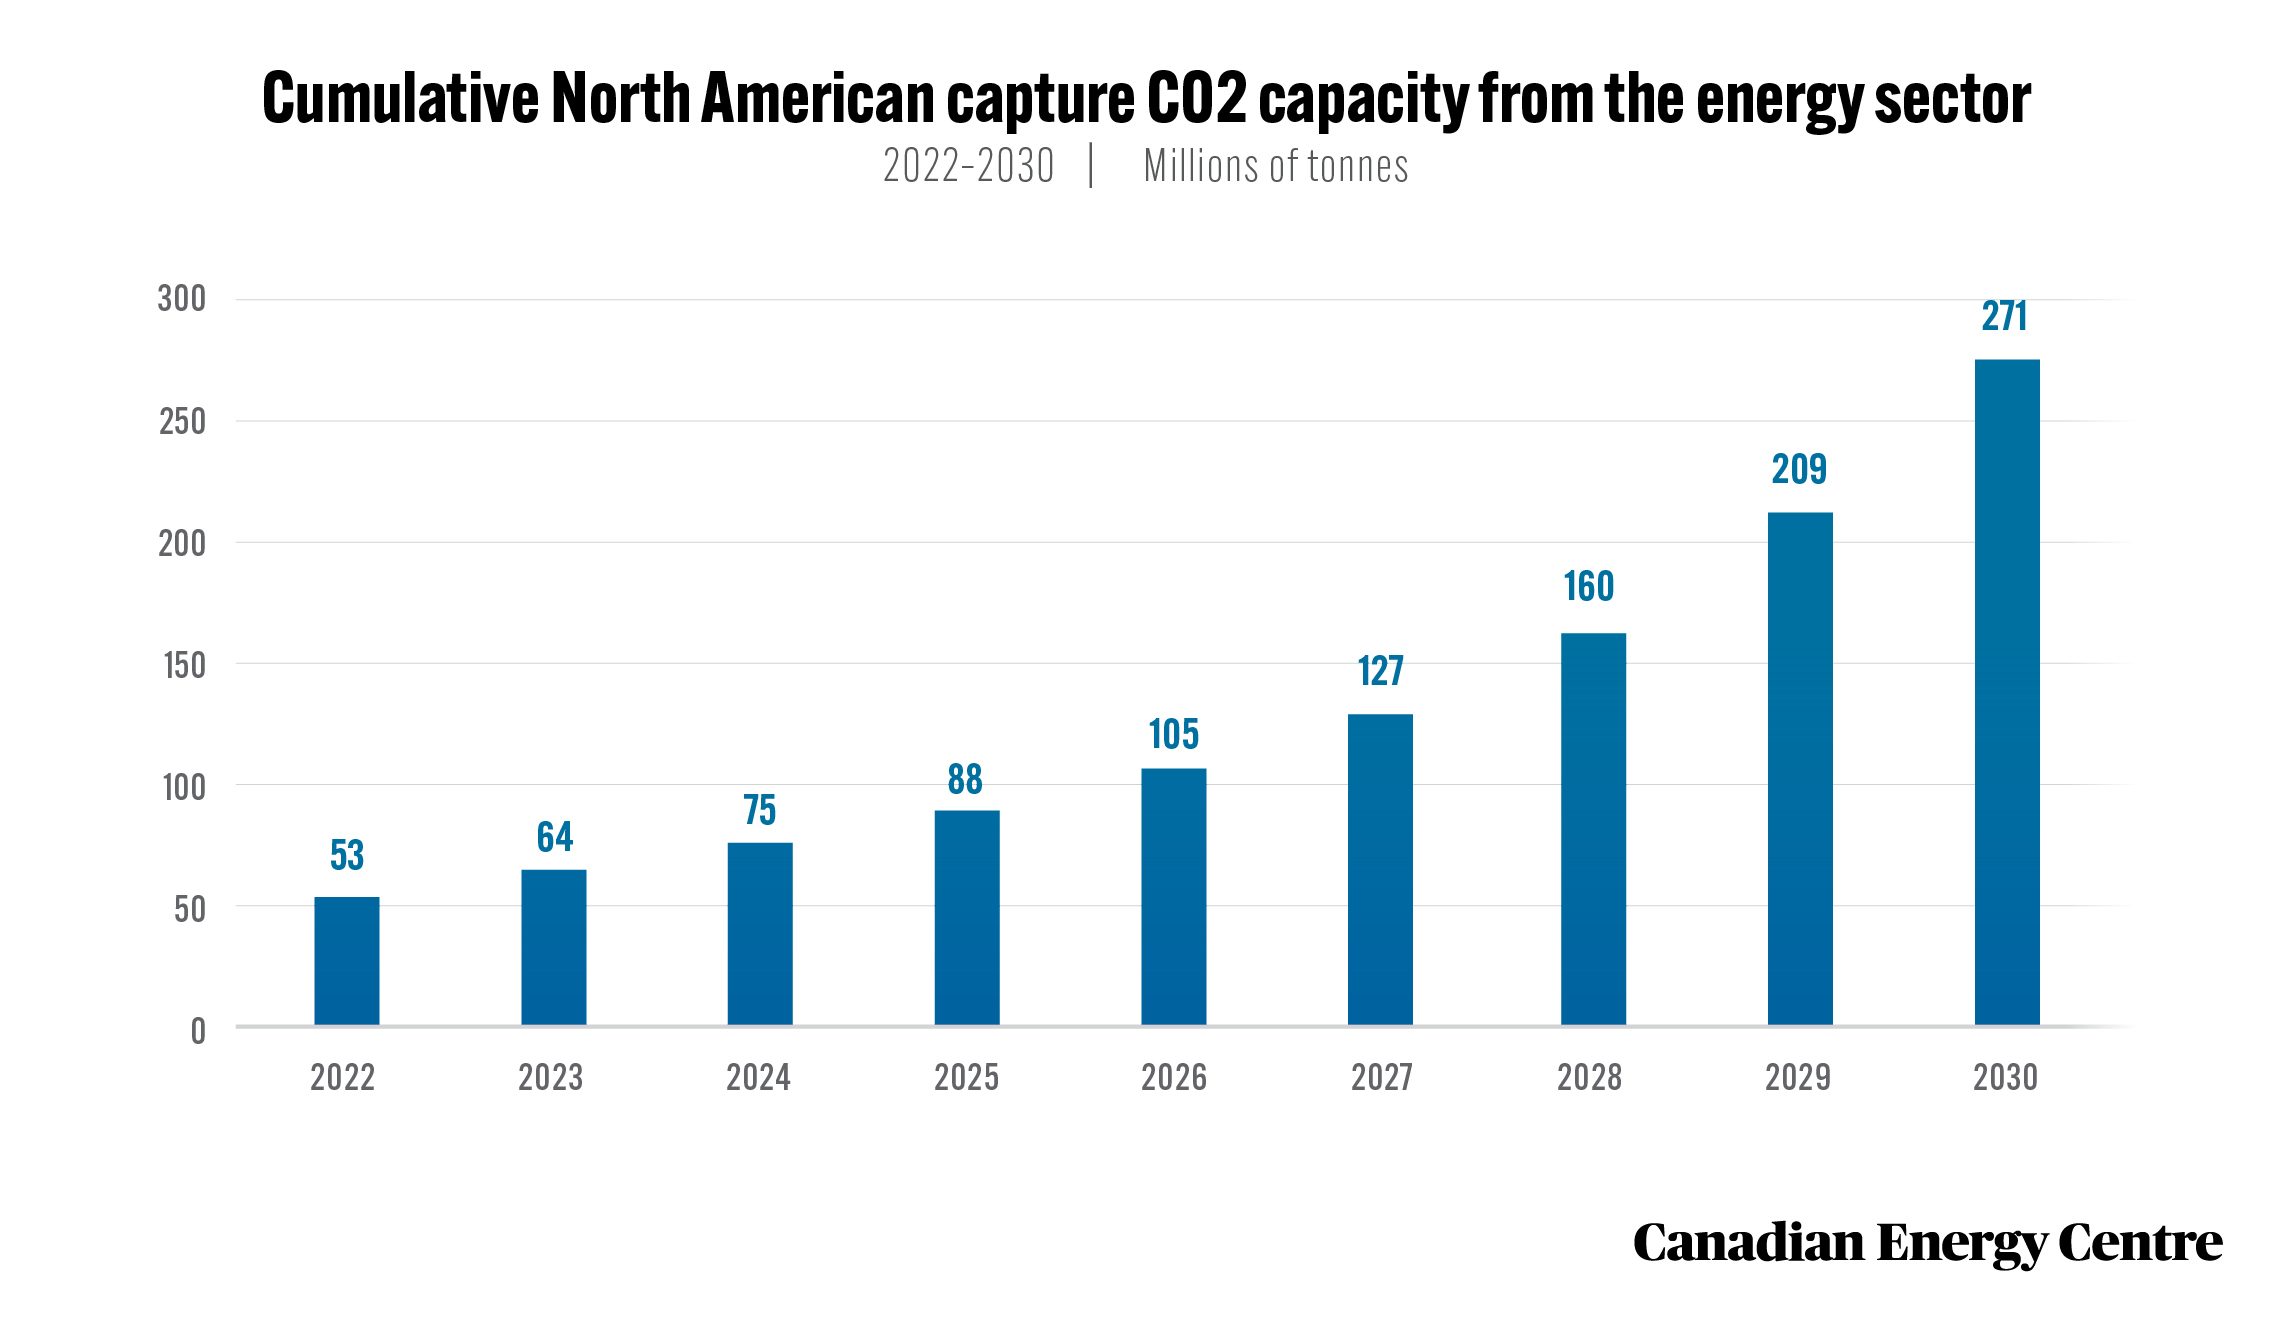
It is estimated that Canada’s energy sector could increase cumulative CO2 capture capacity to 88 million tonnes per annum (mtpa) in 2025 and 271 mtpa by 2030 if the proper regulatory fiscal and regulatory instruments are in place. Based on a supply chain analysis of CCUS projects likely to proceed by 2025, Canadian in CCUS projects are set to reach over $6.4 billion (cumulative) in investment between 2022 and 2025, with nearly $5.8 billion invested in capture, $496 million in storage, and $133 million in transport.
Source: Derived from the Rystad Energy CCUS Market Dashboard.
18.
Long term impact of Carbon Capture, Utilization and Storage (CCS) in Canada
GDP from Carbon Capture, Utilization and Storage (CCUS) has the potential to reach between $7 billion and $52 billion per year in CA$2020 by 2050 under net zero scenarios. This wide range is driven by many factors including the cost of CCUS, the cost of alternative technologies, and the drivers of output in industries with significant CCUS adoption, and oil prices. GDP from CCUS comes from the construction of facilities and operations for storing captured carbon.
19.
The economic impact of Direct Air Capture (DAC)
According to a study conducted by Navius Research for CEC, GDP from Direct Air Capture could range from $0 to $51 billion CA$2020 per year by 2050. The $0 value comes from a scenario in which no DAC is available, as well as scenarios with high DAC costs and lower relative costs for alternatives, such as CCUS and hydrogen. When available at lower cost, DAC adoption drives GDP growth from DAC operations, construction of facilities, manufacturing of inputs, and the sale of carbon offsets to other sectors. The value of offsets sold by the sector is a function of the annual CO2 abatement from DAC facilities and the shadow price of carbon each year, i.e., the marginal cost of abatement.
20.
The economic impact of the hydrogen sector
GDP from hydrogen ranges from $13 billion to $59 billion in CA$2020 per year by 2050. Similar to the case of CCS, the range of GDP contributions from hydrogen are driven by the cost of hydrogen technology and alternatives, as well as growth in industries with significant potential for hydrogen adoption, such as oil and gas. GDP from hydrogen comes from building hydrogen infrastructure, producing hydrogen, and the sale of hydrogen for use in a range of sectors, including transport and heavy industry.
Economy
21.
The Canadian oil and gas sector’s contribution to the national economy
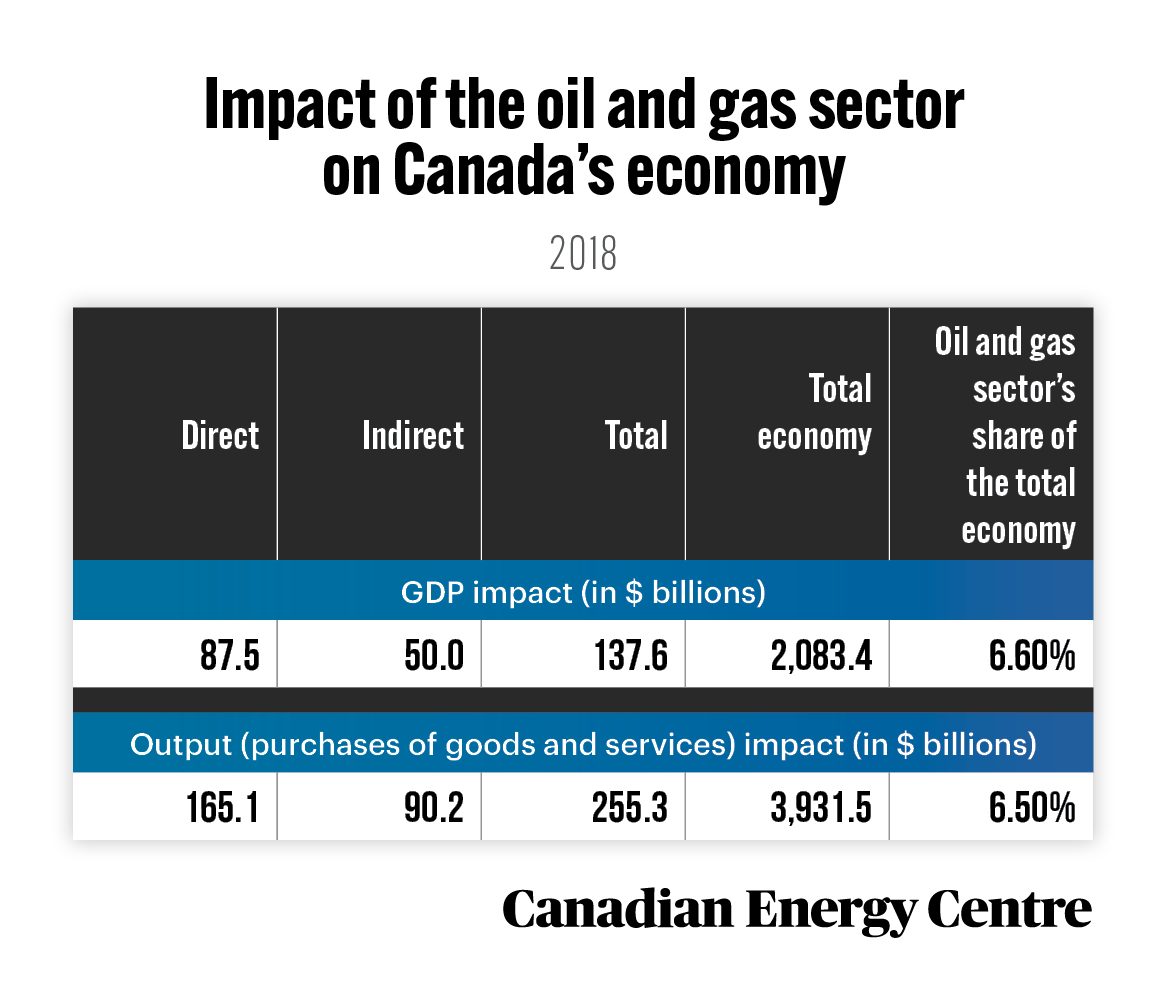
The oil and gas sector makes an outsized contribution to the Canadian economy not only in healthy years, but also in down years, such as in 2018. In 2018, the GDP associated with Canada’s oil and gas sector totalled $137.6 billion, or 6.6 per cent of the entire Canadian economy.
Source: Derived from Statistics Canada, Custom Tabulation of the Supply and Use Tables, 2018
22.
The oil and gas sector’s contribution to Atlantic Canada’s economy
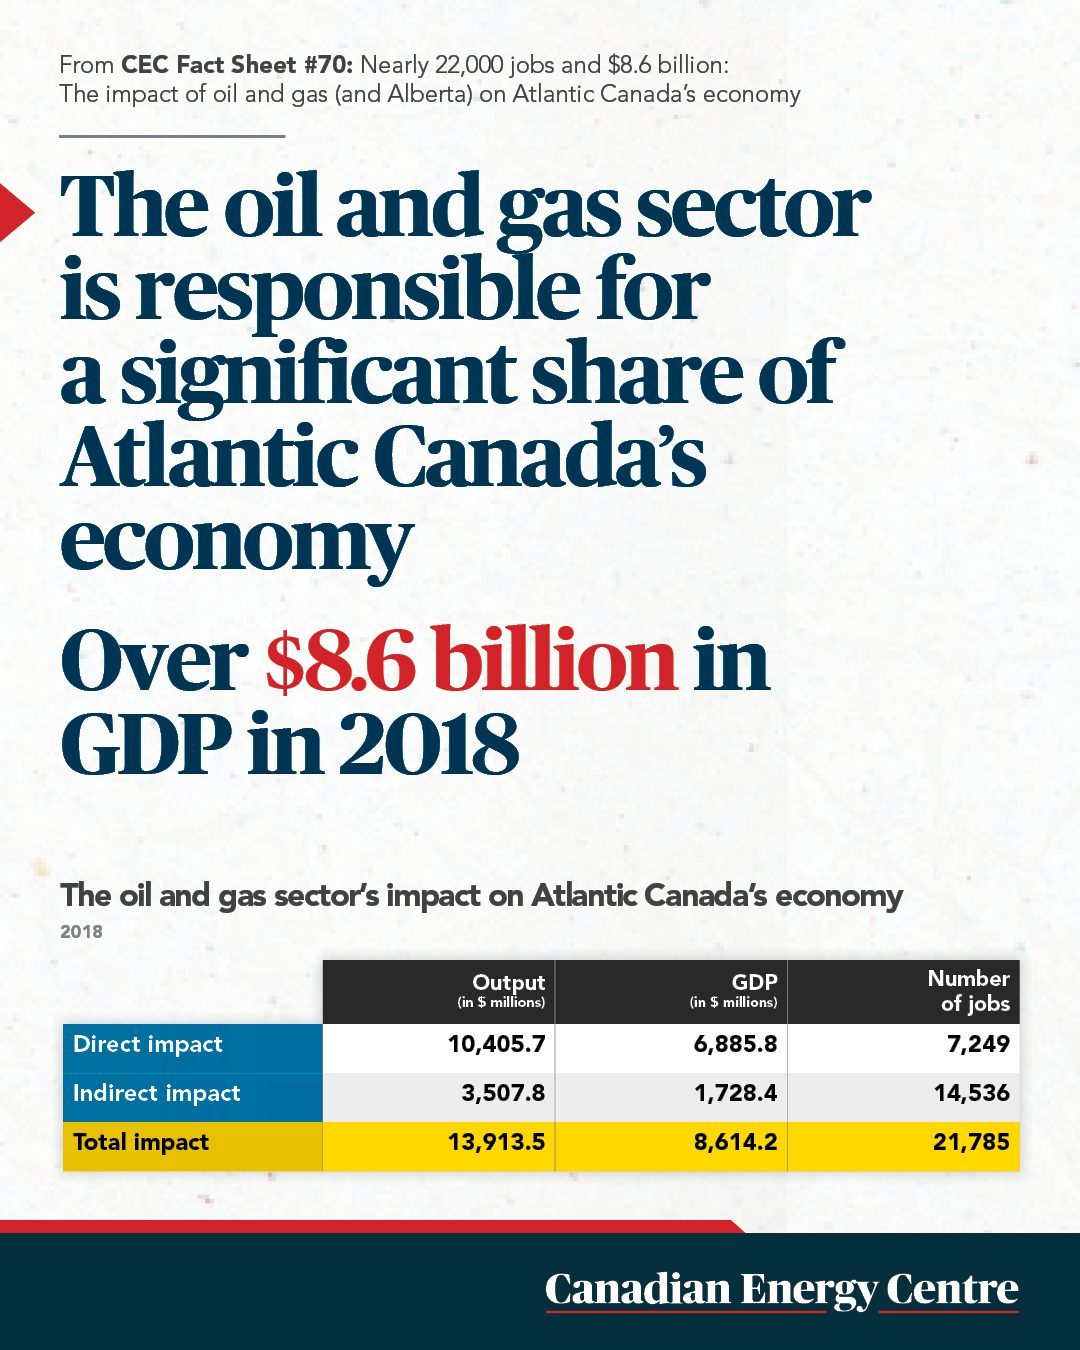
The oil and gas sector was responsible for adding $8.6 billion in nominal GDP to Atlantic Canada’s economy in 2018 and generating $13.9 billion in outputs, consisting primarily of the value of goods and services produced by the sector in the region’s economy.
23.
Purchases by Atlantic Canada’s oil and gas sector from other industries
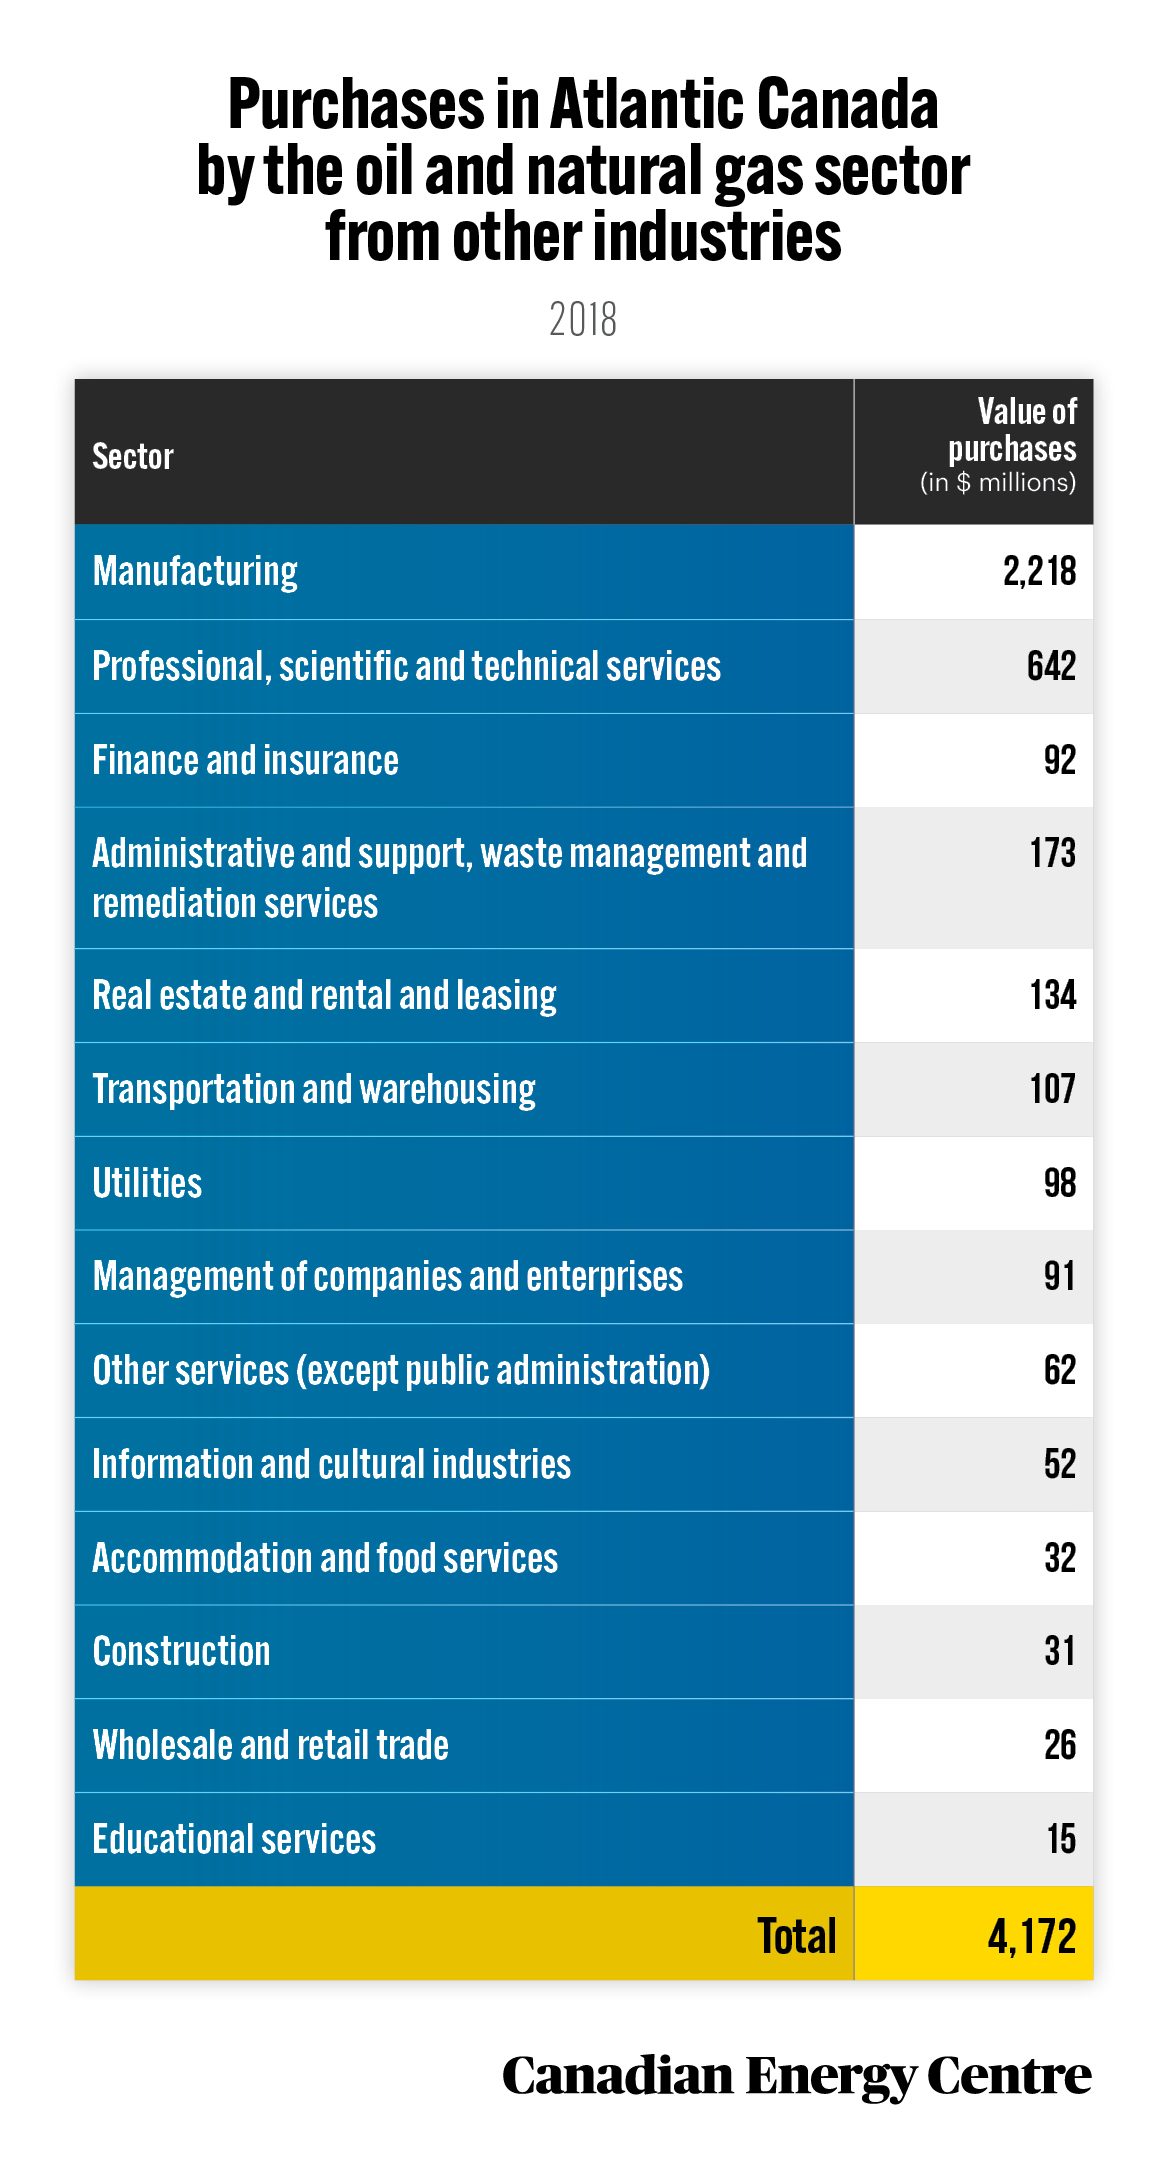
In 2018, the oil and gas sector purchased nearly $4.1 billion worth of goods and services from other sectors in Atlantic Canada, including $642 million from the professional, scientific, and technical services sector, and over $2.2 billion in manufacturing.
24.
Atlantic Canada’s interprovincial trade with Alberta
Alberta plays a significant role in Atlantic Canada’s interprovincial and international trade flows. Atlantic Canada’s interprovincial trade with Alberta in 2018 was $1.8 billion, behind the region’s trade with the United States ($22.5 billion), Ontario ($7.8 billion), and Quebec ($6.7 billion), but ahead of trade with international markets such as China ($1.7 billion), and the Netherlands ($1 billion).
Source: Authors’ calculation derived from Supply and Use Tables, Statistics Canada catalogue 15-602-x_2017.
25.
Oil and gas consumption in Quebec
Quebec’s total energy consumption in 2018 was 1,770 petajoules. Fifty-four per cent of the energy Quebec uses comes from refined petroleum products (RRP) and natural gas. At 20 per cent of Canada’s RRP demand, Quebec is the second-largest market for RRP in Canada after Ontario. In 2018, Quebec used 180,000 barrels of gasoline per day and 85,000 barrels of diesel per day. That year the province also used 591 million cubic feet of natural gas per day.
26.
The oil and gas sector’s contribution to Quebec’s economy
The oil and gas sector was responsible for adding $1.8 billion in nominal GDP to Quebec’s economy in 2017 and generated $3.5 billion in outputs, consisting primarily of the value of goods and services produced by the sector.
27.
Quebec’s interprovincial trade with Alberta
Albertans spent a substantial amount on Quebec’s goods and services in 2018. Alberta’s purchases ranged from relatively small amounts in accommodation and food services ($29 million) to considerably more trade in manufactured goods ($4.1 billion), finance and insurance ($1.5 billion), and professional services (including software and research and development) ($1.2 billion). In 2018 alone, interprovincial exports from Quebec to Alberta were worth over $9.7 billion.
28.
The oil and gas sector’s contribution to British Columbia’s economy
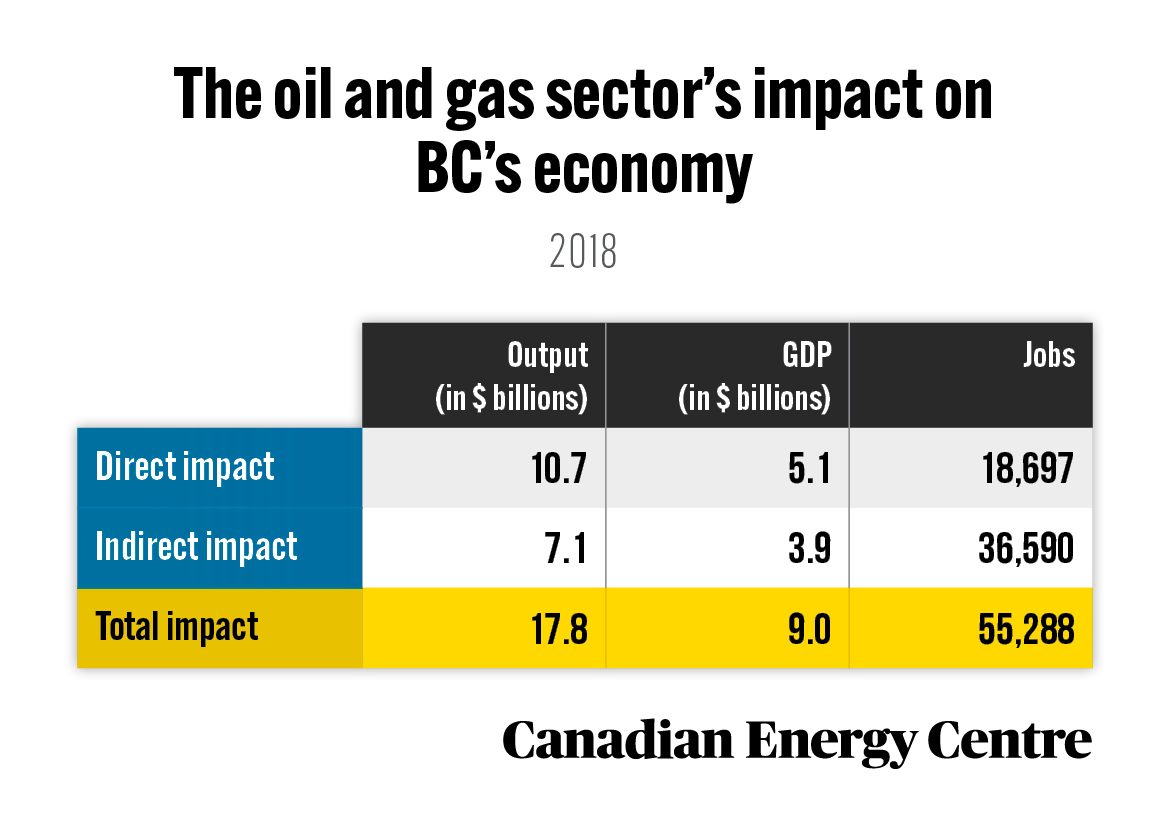
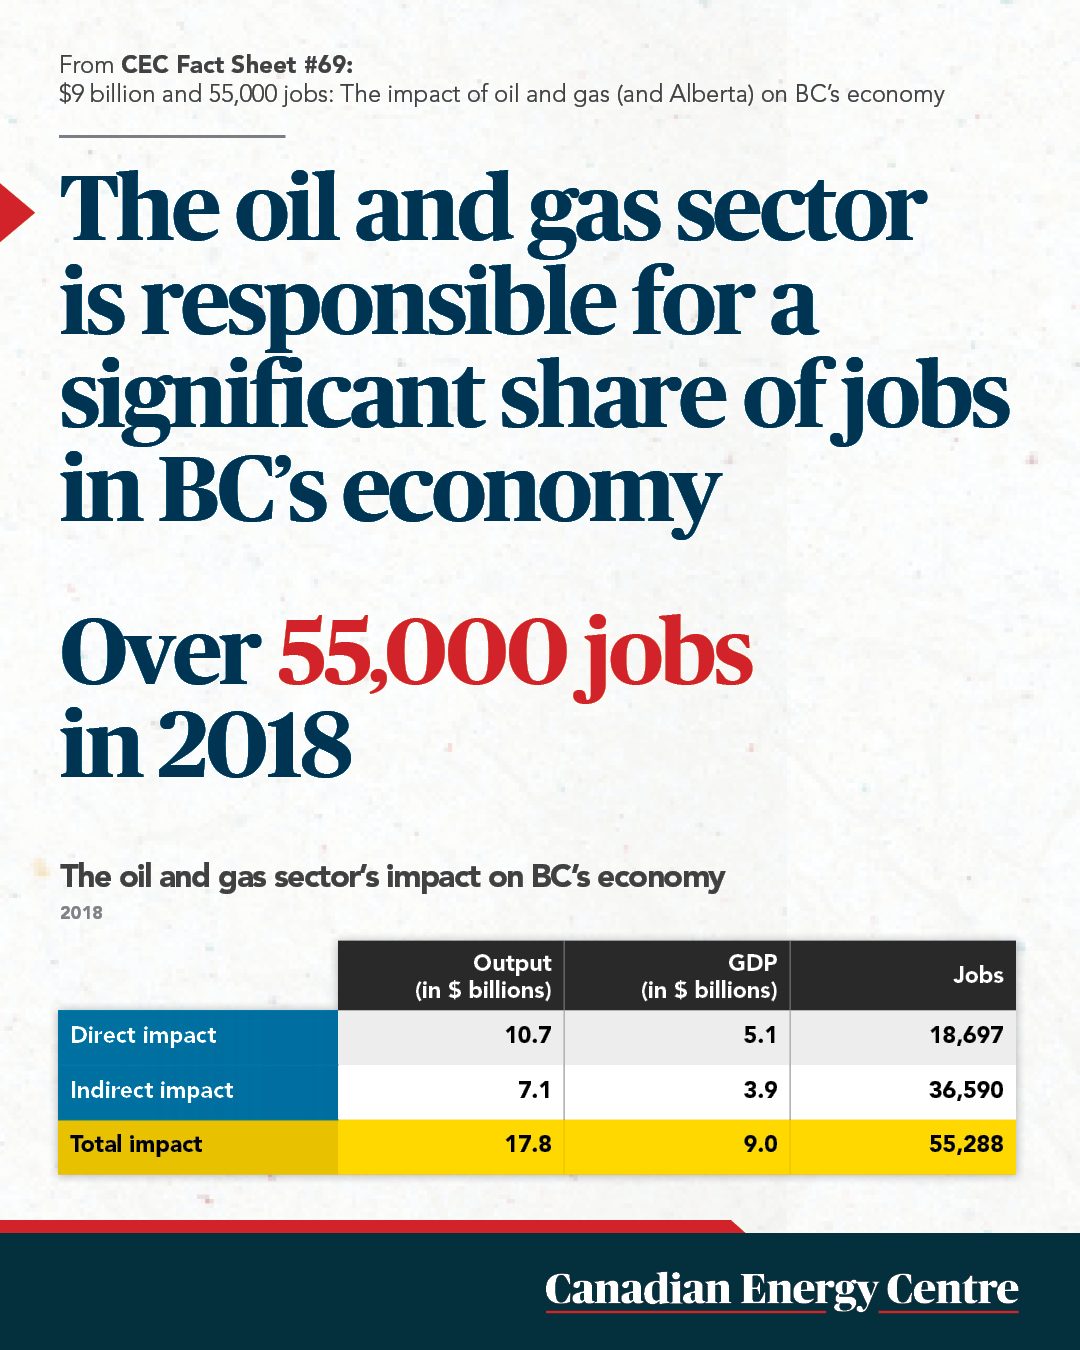
The oil and gas sector was responsible for adding $9 billion in nominal GDP to British Columbia’s economy in 2018 and generated $17.8 billion in outputs that year, consisting primarily of the value of goods and services produced by various sectors in the BC economy.
29.
Purchases by the oil and gas sector from other industries in British Columbia
In 2018, the oil and gas sector purchased nearly $6.3 billion worth of goods and services from other sectors in British Columbia including $652.6 million from the insurance sector, $861.3 million in professional services, and nearly $3.2 billion in manufacturing.
30.
British Columbia’s interprovincial trade with Alberta
British Columbia’s trade with Alberta was worth $16.7 billion, or 39 per cent of all of BC’s interprovincial trade in 2018, surpassing BC’s trade with Ontario and Quebec.
Source: Derived from Statistics Canada, Supply and Use Tables, Custom Tabulation. Totals may not add exactly due to rounding.
Small Businesses and Canadian Oil and Gas
31.
Small businesses in Canada’s oil and gas sector
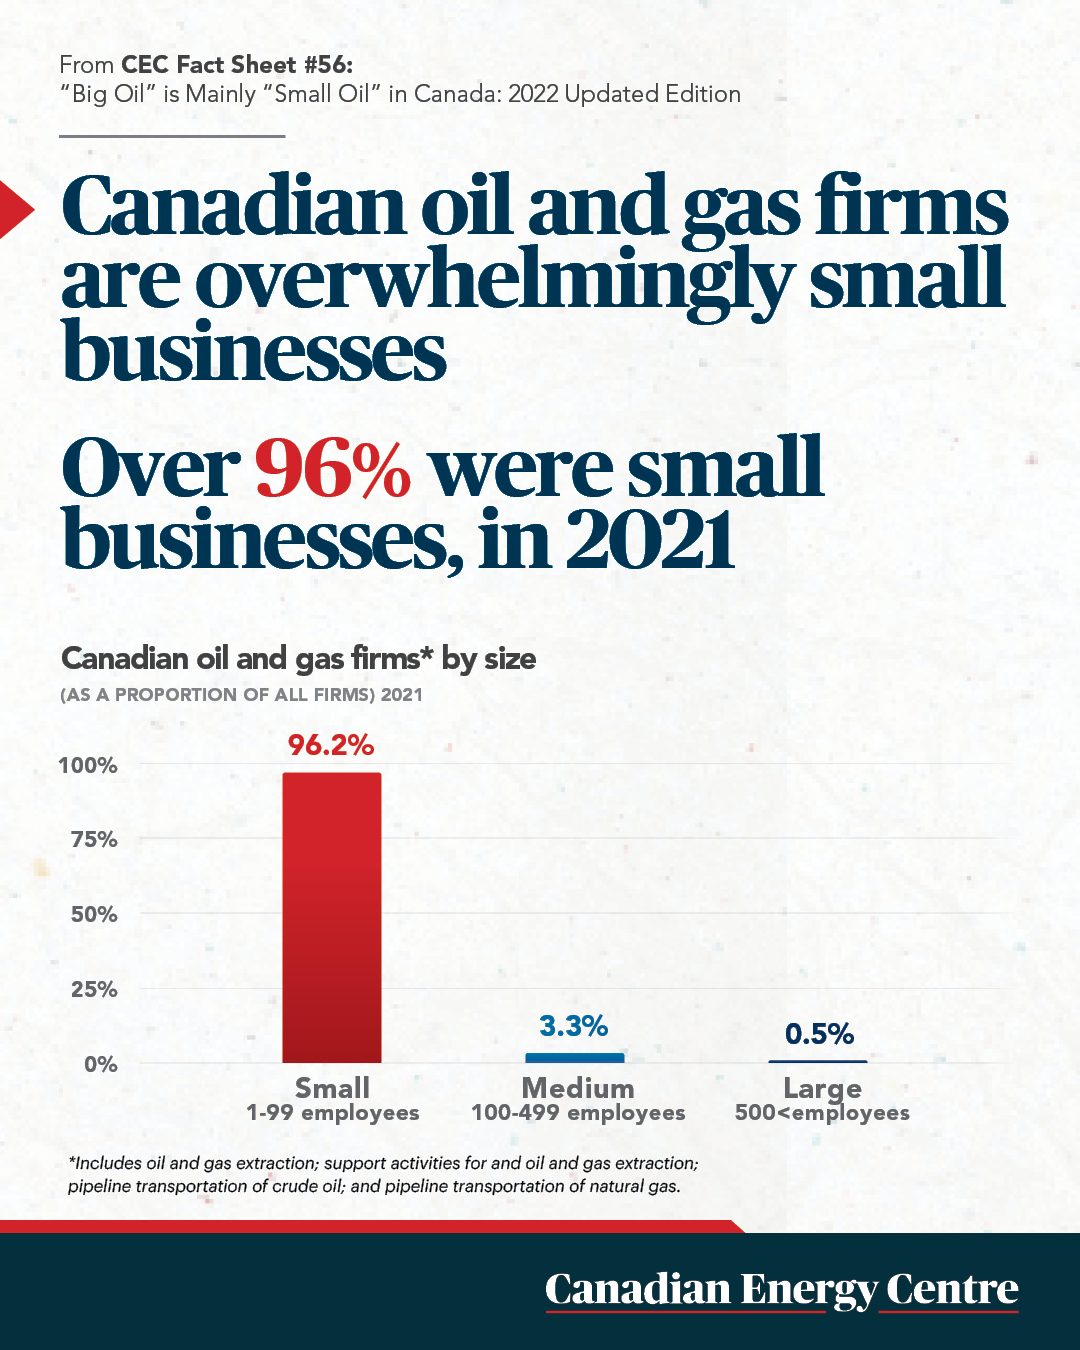
In Canada, 96 per cent of the companies in the oil and gas sector are small businesses (fewer than 100 employees), while 3.3 per cent are medium-sized (100 to 499 employees), and 0.5 per cent are large enterprises (500+ employees).
32.
Small business industry comparison
As of 2021, 96.2 per cent of all energy firms have between 1 and 99 employees compared with 93.1 per cent in manufacturing, 89.9 per cent in utilities, and 99 per cent in the construction sector. The all-industry average is 98 per cent.
33.
Canada-U.S. comparisons of small business in oil and gas extraction
For just those firms involved in oil and gas extraction, 96.2 per cent of Canada’s oil and gas extraction sector is composed of small businesses, compared to 94.2 per cent in the United States.
34.
Number of firms involved in oil and gas extraction in Canada and Europe
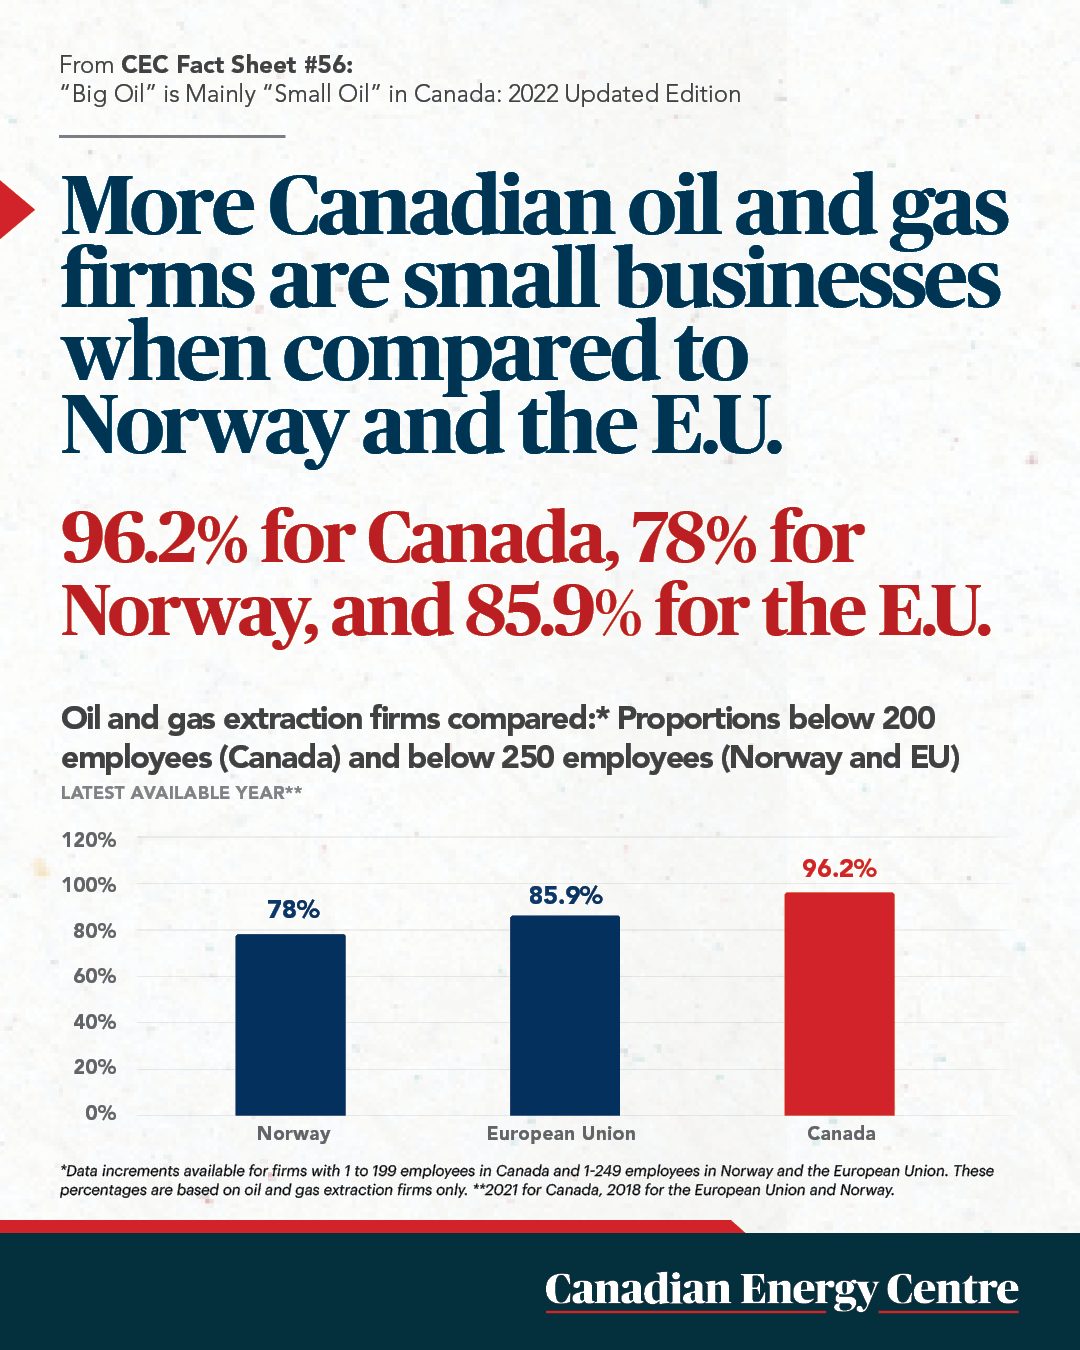
Canada’s oil and gas extraction sector has a higher proportion of small and medium-sized businesses than either Norway or the EU.
- Canada has 1,135 oil and gas firms with fewer than 200 employees;
- The European Union has 329 firms with fewer than 250 employees; and
- Norway has just 32 oil and gas firms with fewer than 250 employees.
Jobs in Canada’s Oil and Gas Sector
35.
Employment in Canada’s oil and gas sector
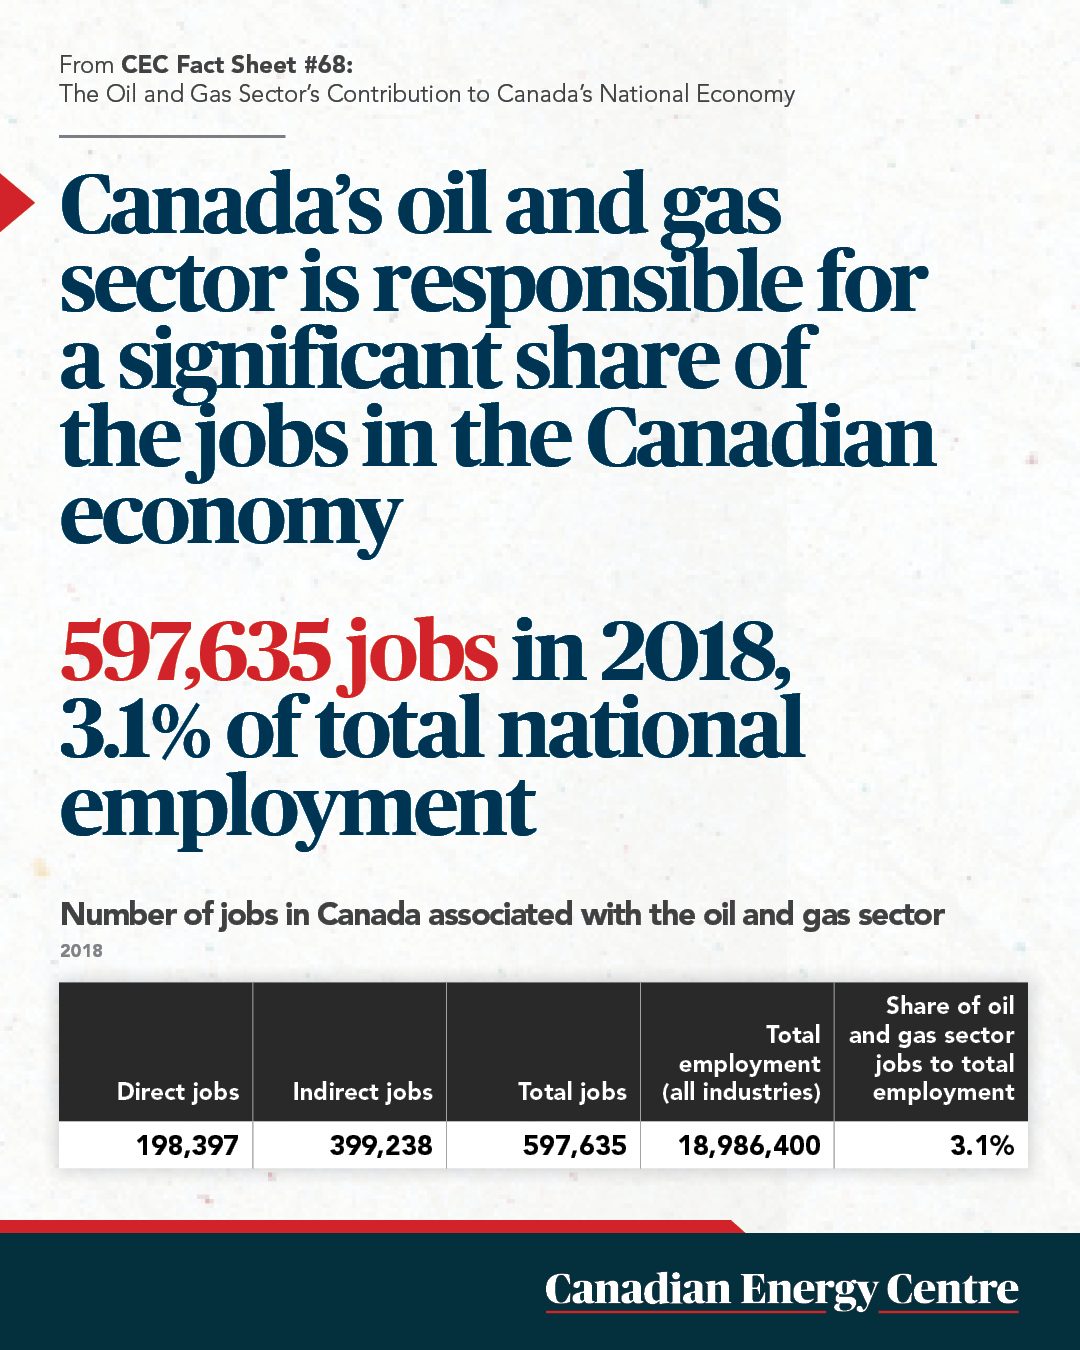
There were 597,635 jobs associated with Canada’s oil and gas sector in 2018 – 198,397 direct and 399,238 indirect – representing about 3.1 per cent of all jobs across Canada. That same year, the total compensation paid to oil and gas extraction sector workers alone was over $13.8 billion.
36.
Employment and wages in Atlantic Canada
In 2018, oil and gas supported nearly 22,000 jobs in Atlantic Canada, directly and indirectly paying over $1.4 billion in wages and salaries to workers in Atlantic Canada.
37.
Employment and wages in British Columbia
Oil and gas supported over 55,000 jobs, both direct and indirect, in BC in 2018 and paid over $2.9 billion in wages and salaries to workers in that province.
Pipelines and Exports
38.
Crude oil and gas exports from Canada
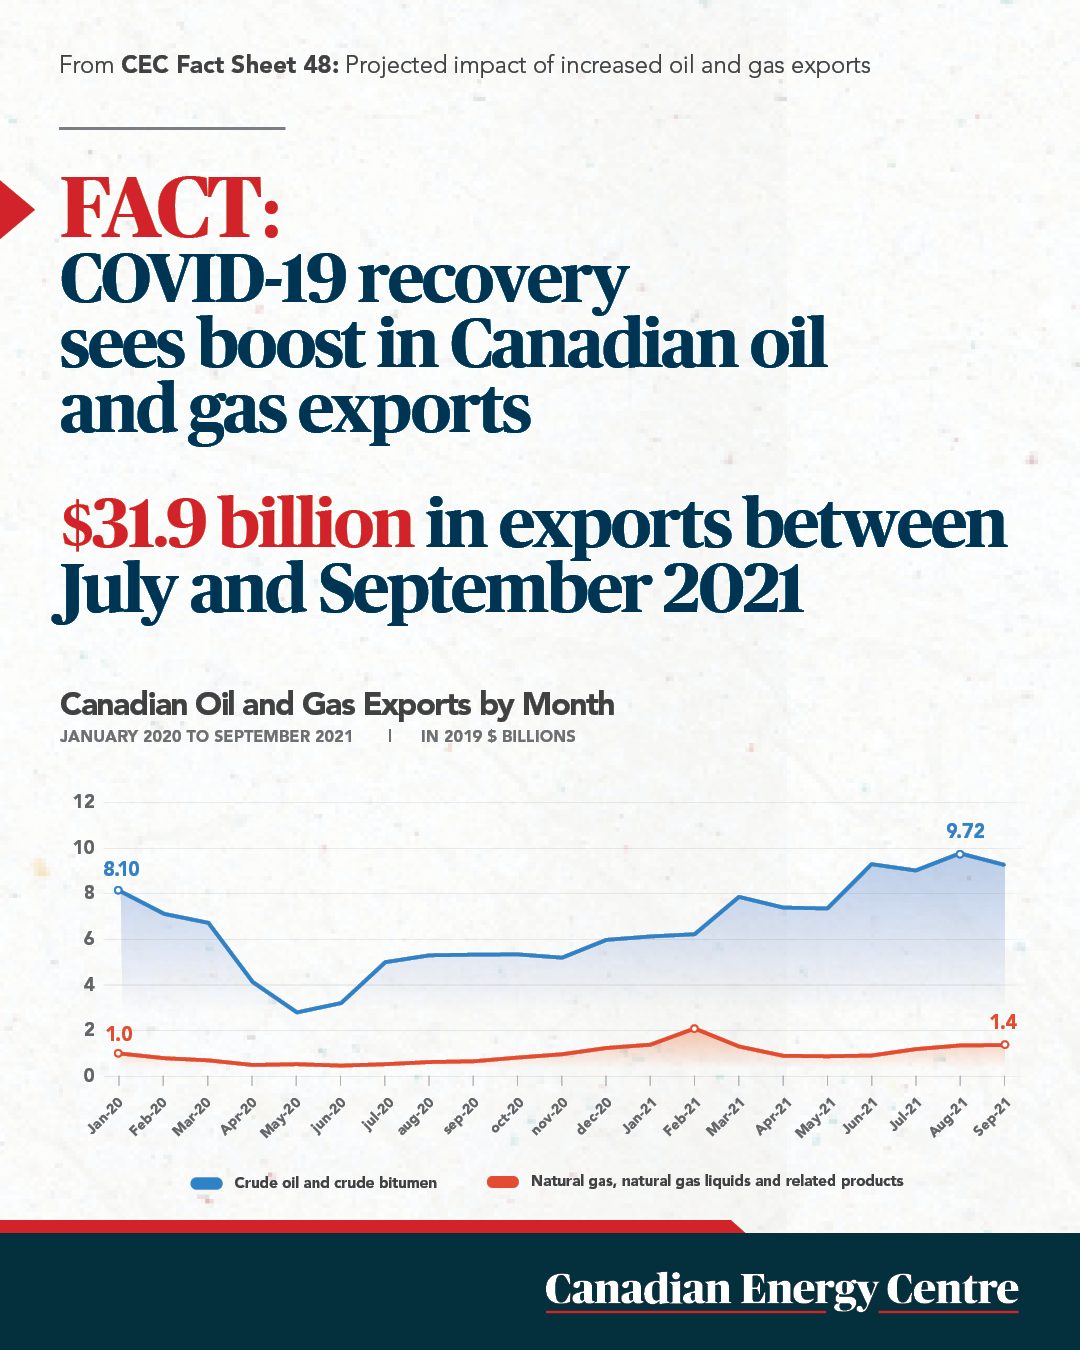
In 2020, COVID-19 had a devastating impact on Canadian crude oil and natural gas exports. However, as the global economy has begun to recover from COVID-19, the demand for oil and gas has increased. Alberta saw record crude oil production in the first half of 2021, averaging 3.53 million barrels per day. International crude oil exports from Canada have also increased: between July and September 2021, Canada exported $31.9 billion worth of oil and gas.
39.
Crude oil export by pipelines
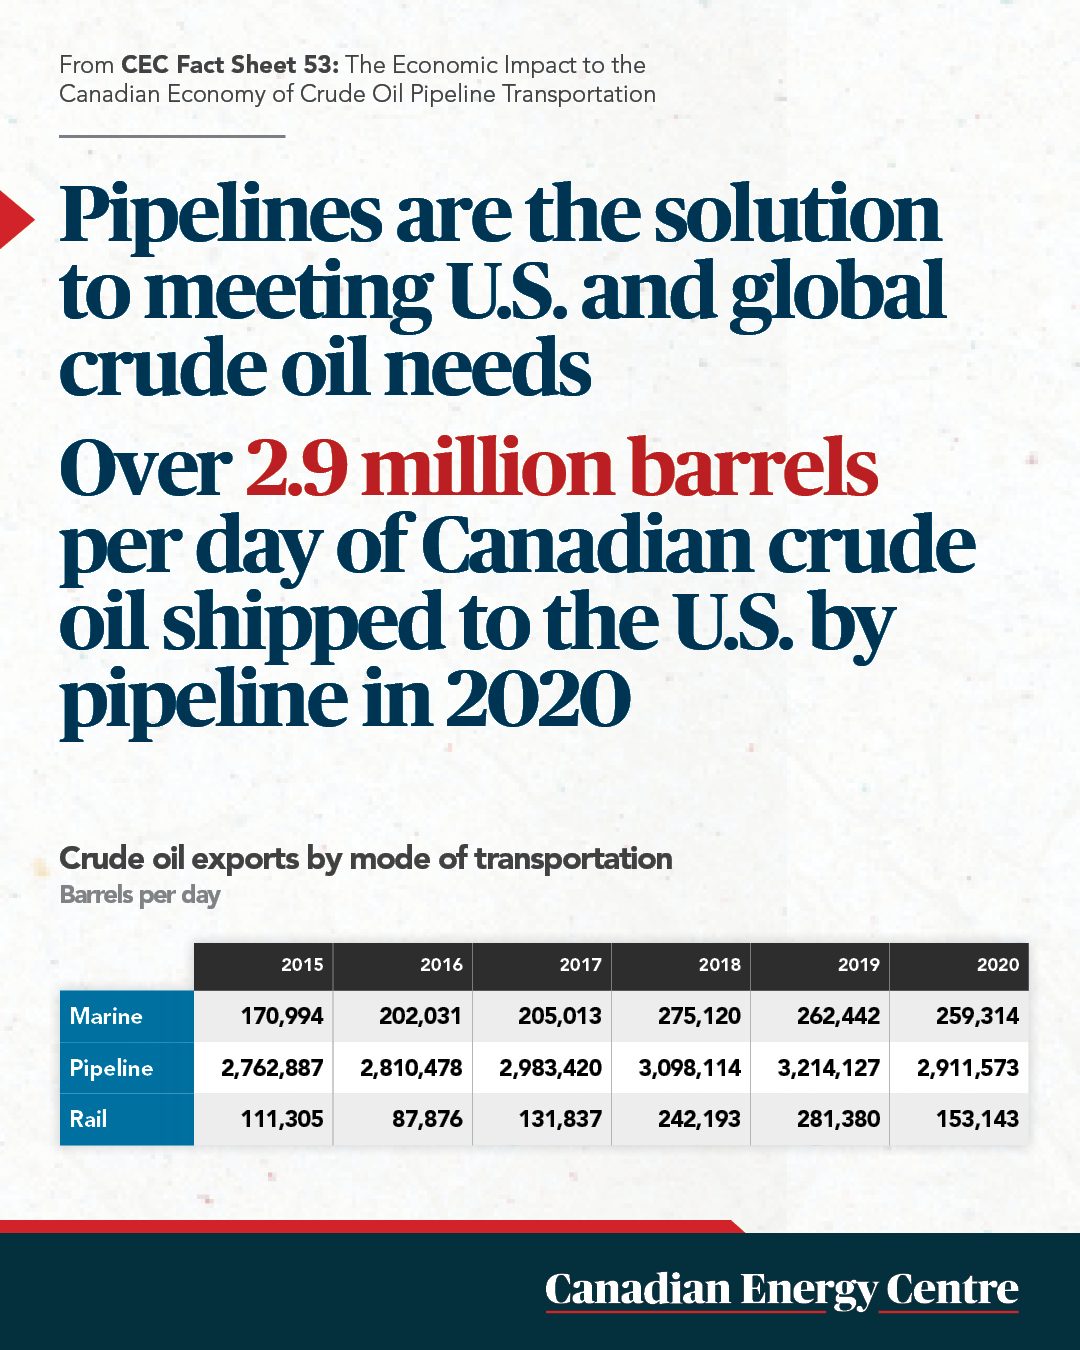
Between 2010 and 2020, exports of crude oil leaving Canada by pipeline grew from over 1.7 million barrels per day (mb/d) to over 3.2 mb/d, an 84 per cent increase. In 2020, total crude oil exports from Canada were nearly 3.7 mb/d, with over 2.9 million barrels per day, or nearly 88 per cent, being moved by pipeline, mainly to the U.S. Enbridge’s Canadian Mainline transports 58 per cent of all Canadian crude oil exported to the United States
40.
Projected impact of increased Canadian oil and gas exports
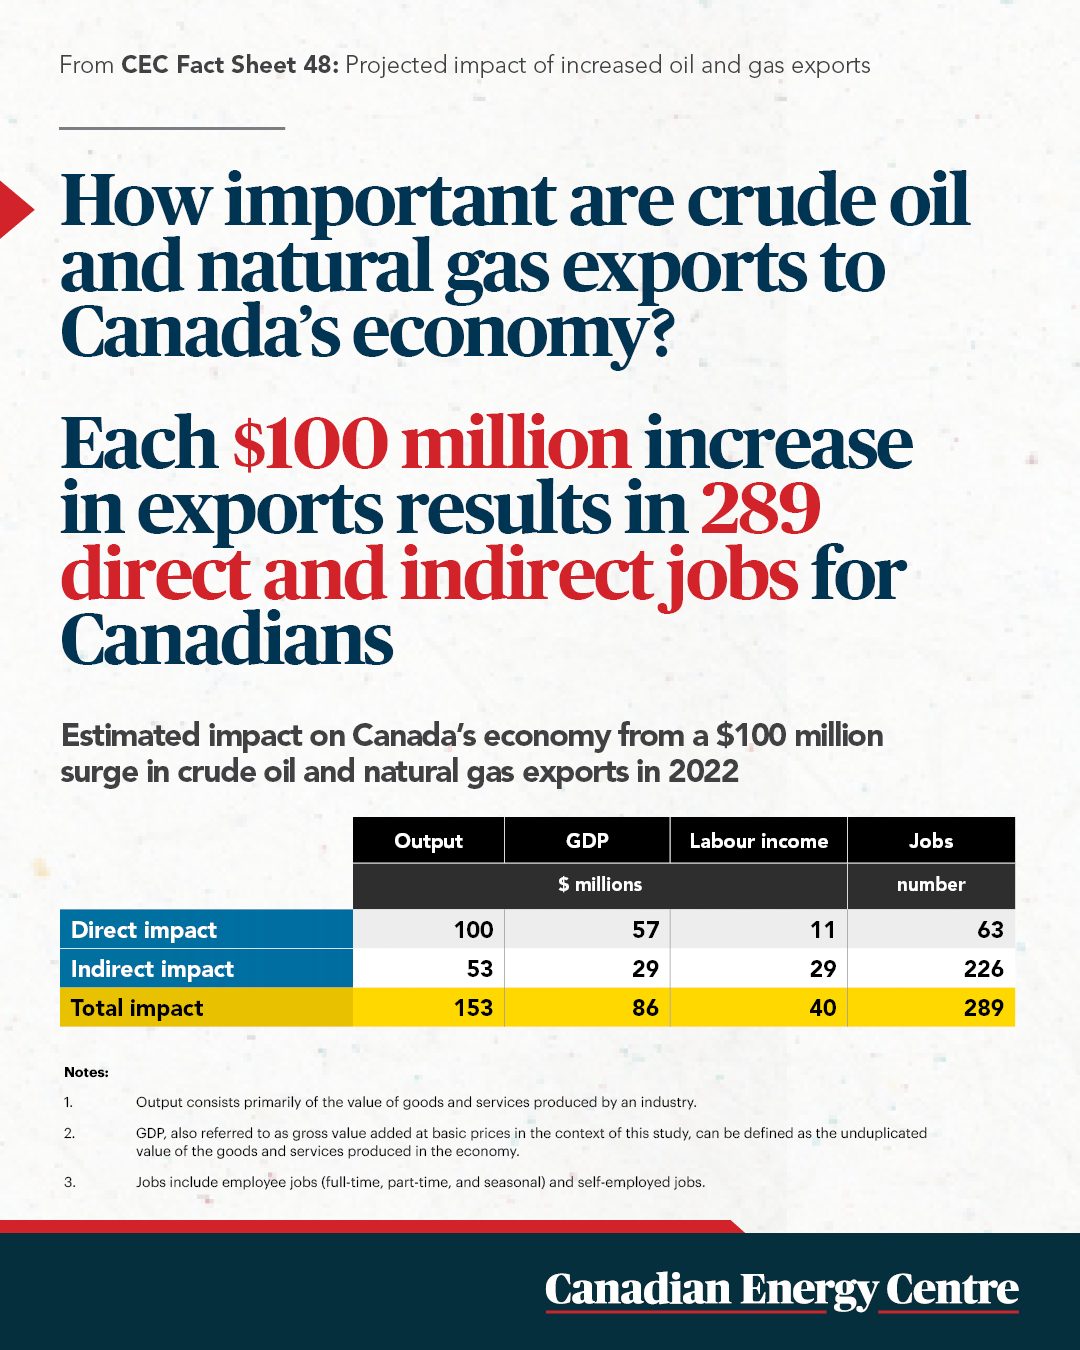
Modelling finds that each $100 million increase in crude oil and natural gas exports is estimated to support 289 direct and indirect Canadian jobs and add $40 million to labour income in 2022. The same modelling found that each $100 million increase in crude oil and natural gas exports is estimated to add $86 million to nominal GDP while generating nearly $153 million in outputs in 2022.
41.
Examining the impact of increased pipeline access
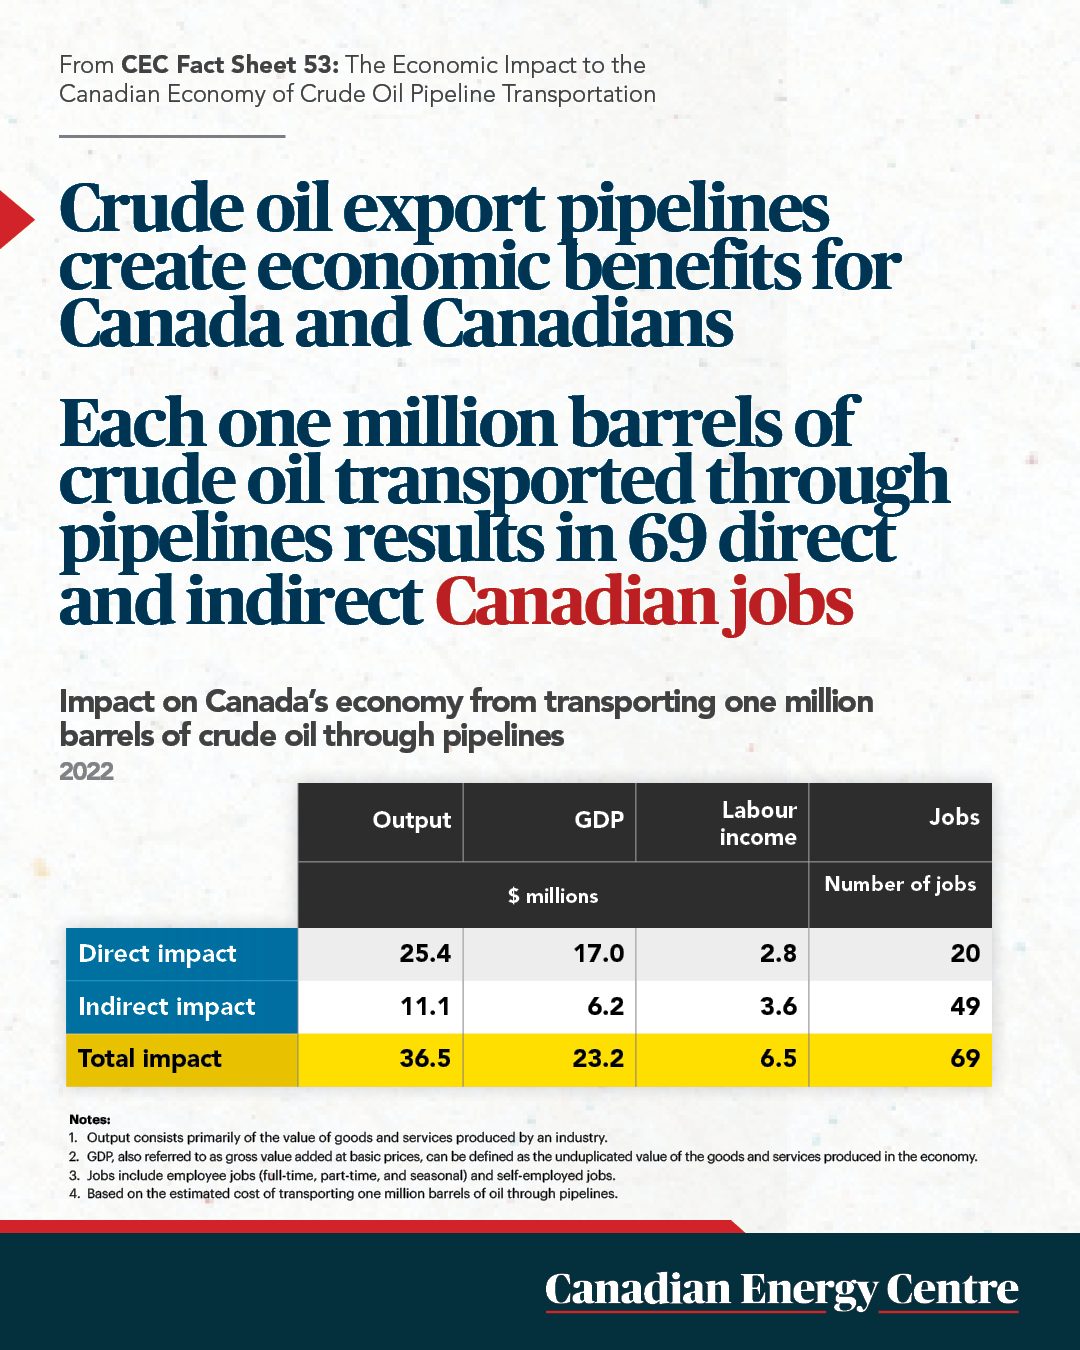
The percentage of heavy oil that the U.S. imports from Canada as a share of all imports of Canadian oil increased from 25.1 per cent in 2000 to 55.8 per cent in 2019. Additional export pipeline capacity would enable Canadian oil producers to receive up to US$7 per barrel more for their product, lifting capital investment by an estimated $10 billion and affecting real GDP by an estimated 1.5 to two per cent. Each one million barrels of crude oil transported through pipelines will add $23.2 million to nominal GDP in 2022. Further,
- Each one million barrels of crude oil transported through pipelines will support 69 direct and indirect Canadian jobs in 2022;
- Each one million barrels of crude oil transported through pipelines will generate nearly $36.5 million in outputs in 2022, consisting primarily of the value of goods and services produced; and
- Each one million barrels of crude oil transported through pipelines will add $6.5 million to labour income in 2022.
Social and Governance
42.
Women’s employment in Canada’s oil and gas sector
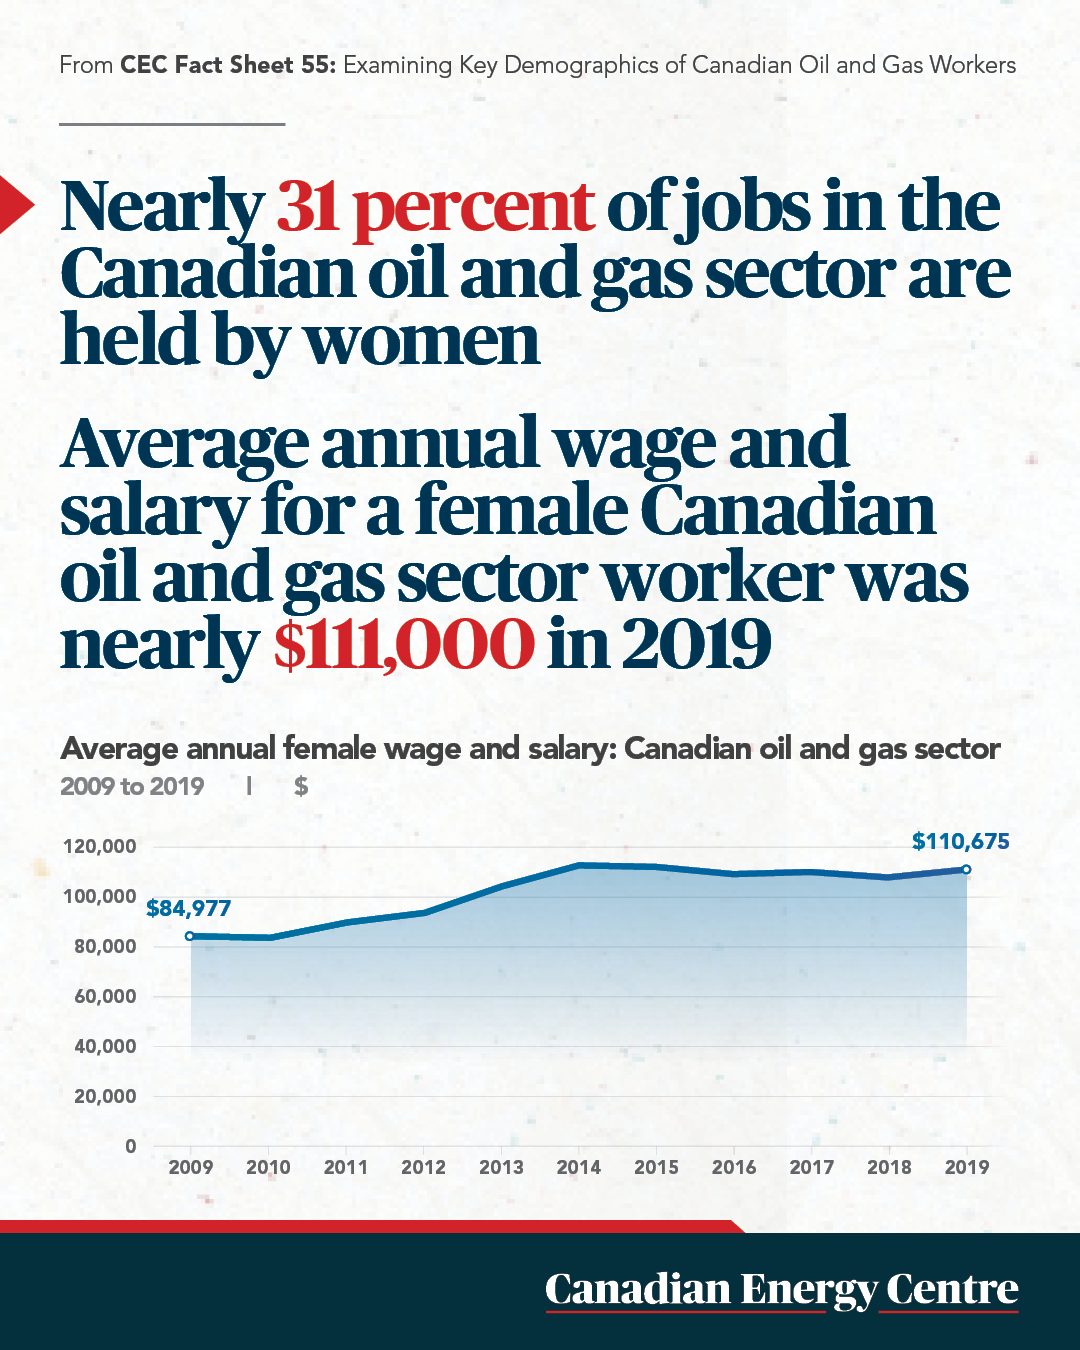
Nearly 31 per cent of jobs in Canada’s oil and gas sector are held by women, and the average pay for women has increased by over 30 per cent since 2009.
43.
Diversity in the oil and gas sector
In 2019, 6.3 per cent of workers in Canada’s oil and gas sector identified as Indigenous, with their average pay increasing by over 7 per cent since 2009. Nearly 24 per cent of workers in the sector identify as visible minorities, with their average pay increasing by over 12 per cent since 2009.
44.
New Canadians in the oil and gas sector
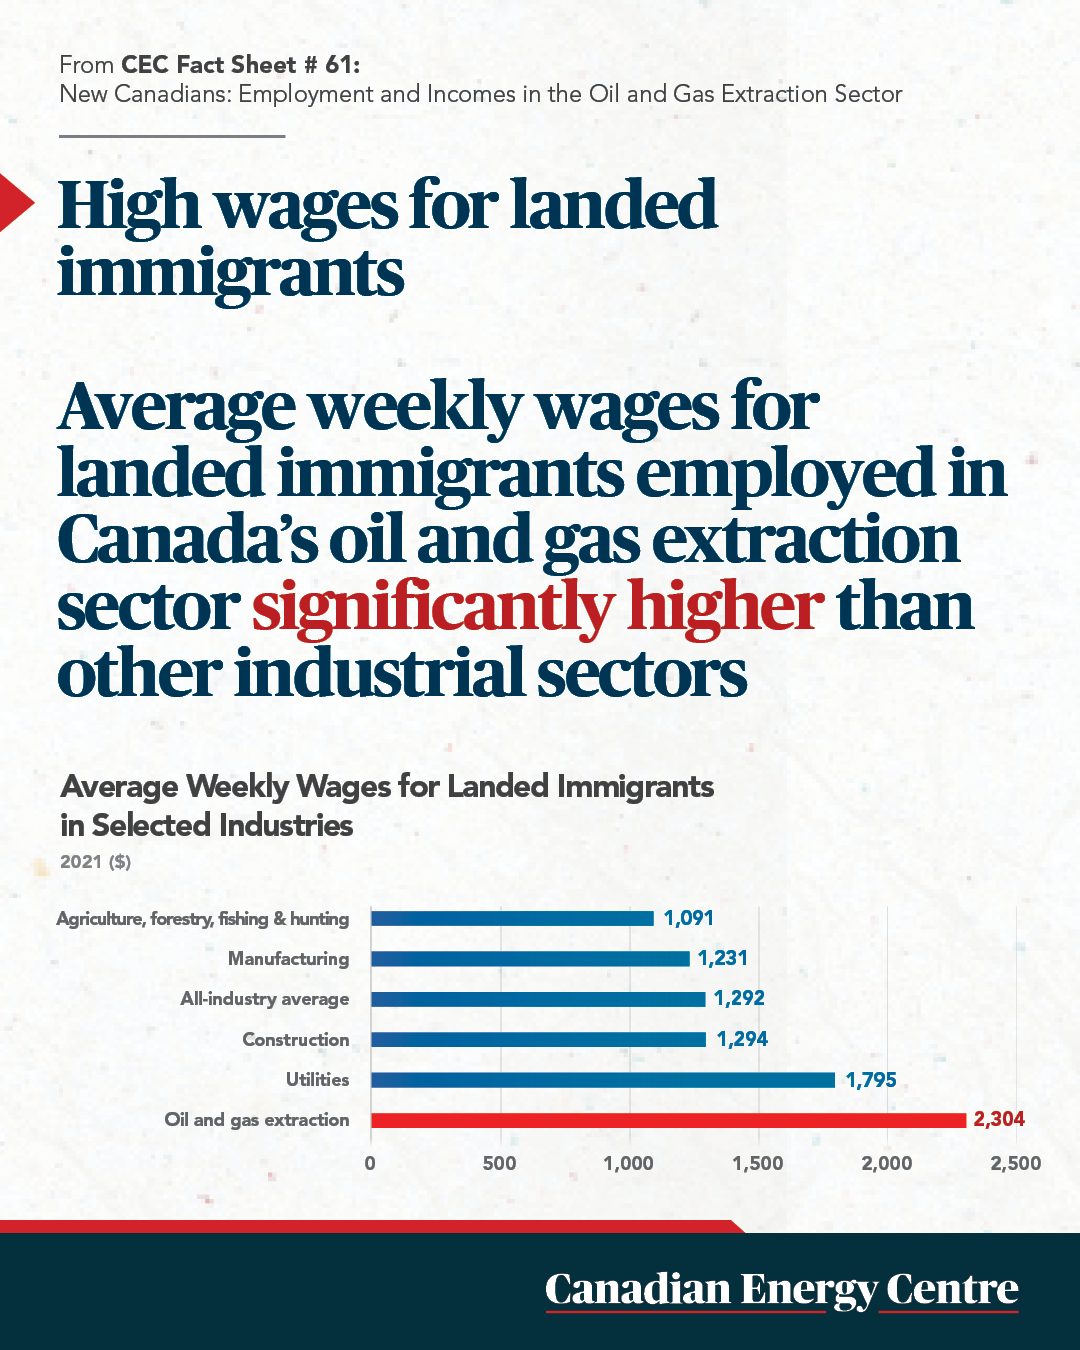
Between 2006 and 2021 the number of landed immigrants employed in Canada’s oil and gas sector increased by over 86 per cent – from 8,800 to 16,400. In 2021, the average weekly wage for landed immigrants in the oil and gas extraction sector was $2,304, or 78 per cent more than the all-industry average weekly wage of $1,292 for landed immigrants. Between 2010 and 2021, average weekly wages for landed immigrants employed in the oil and gas extraction sector grew from $1,634 to $2,304, or nearly 41 per cent.
Liquefied Natural Gas (LNG)
45.
The global LNG market
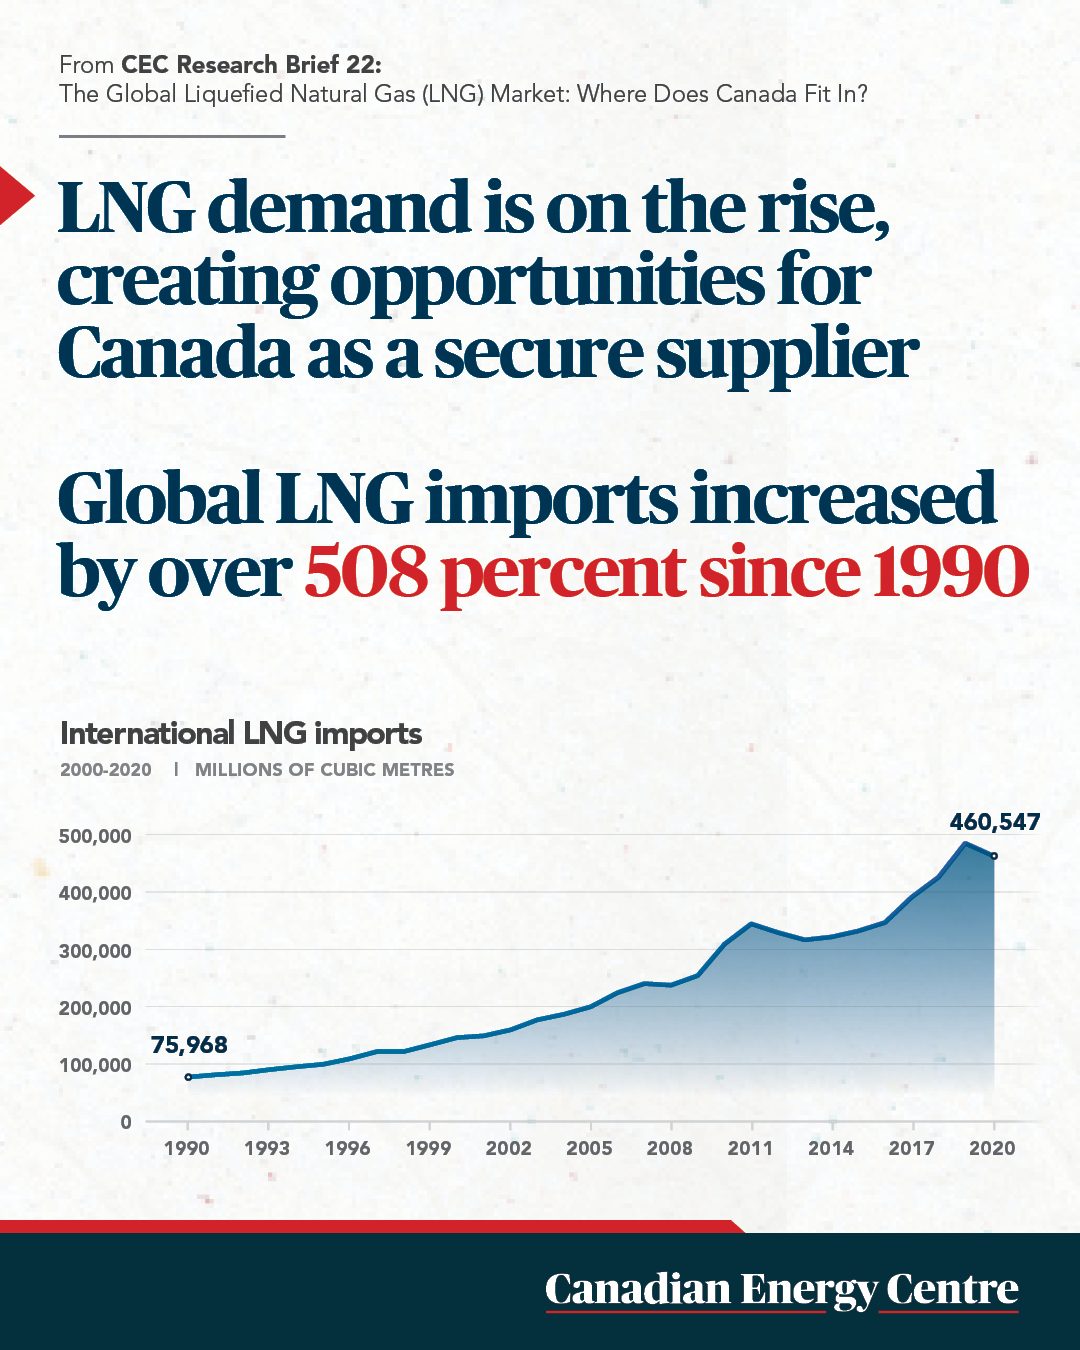
Worldwide imports of natural gas via LNG rose from 97,923 million cubic metres (Mm3) in 1995 to 460,547 Mm3 in 2020, an increase of 370 per cent, including a 414 per cent increase in imports by Europe over that period, and a 365 per cent increase by Asia. In 2010, total LNG exports were worth just over US$63.6 billion, a figure that increased to almost US$117.4 billion by 2017 before declining to about US$75.9 billion due to COVID-19 and then again increasing to US$157.1 billion in 2021.
46.
Top LNG exporting countries
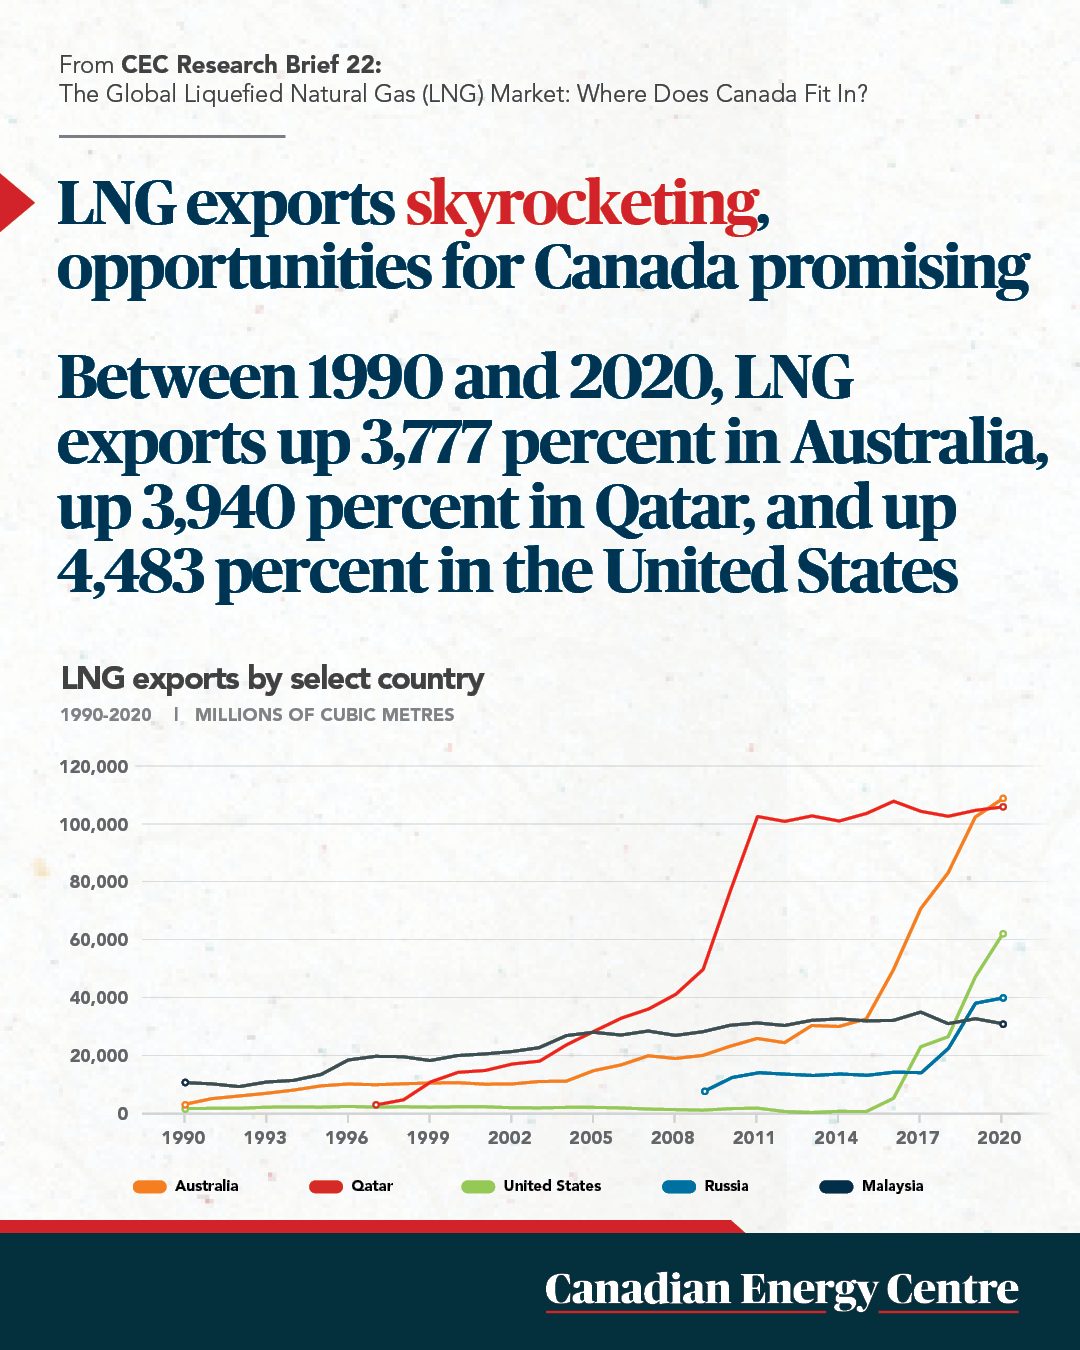
Australia, Qatar, and the U.S. are the world’s top exporters of LNG. As of 2020, Australia accounted for 22.6 per cent of global LNG exports, followed by Qatar (22 per cent) and the U.S. (12 per cent). Several countries saw a significant increase in LNG exports between 1990 and 2020, including Australia with a 3,777 per cent rise, Qatar (3,940 per cent), the U.S. (4,484 per cent), Malaysia (204 per cent) and Russia (444 per cent).
47.
Industrial demand for natural gas in Asia
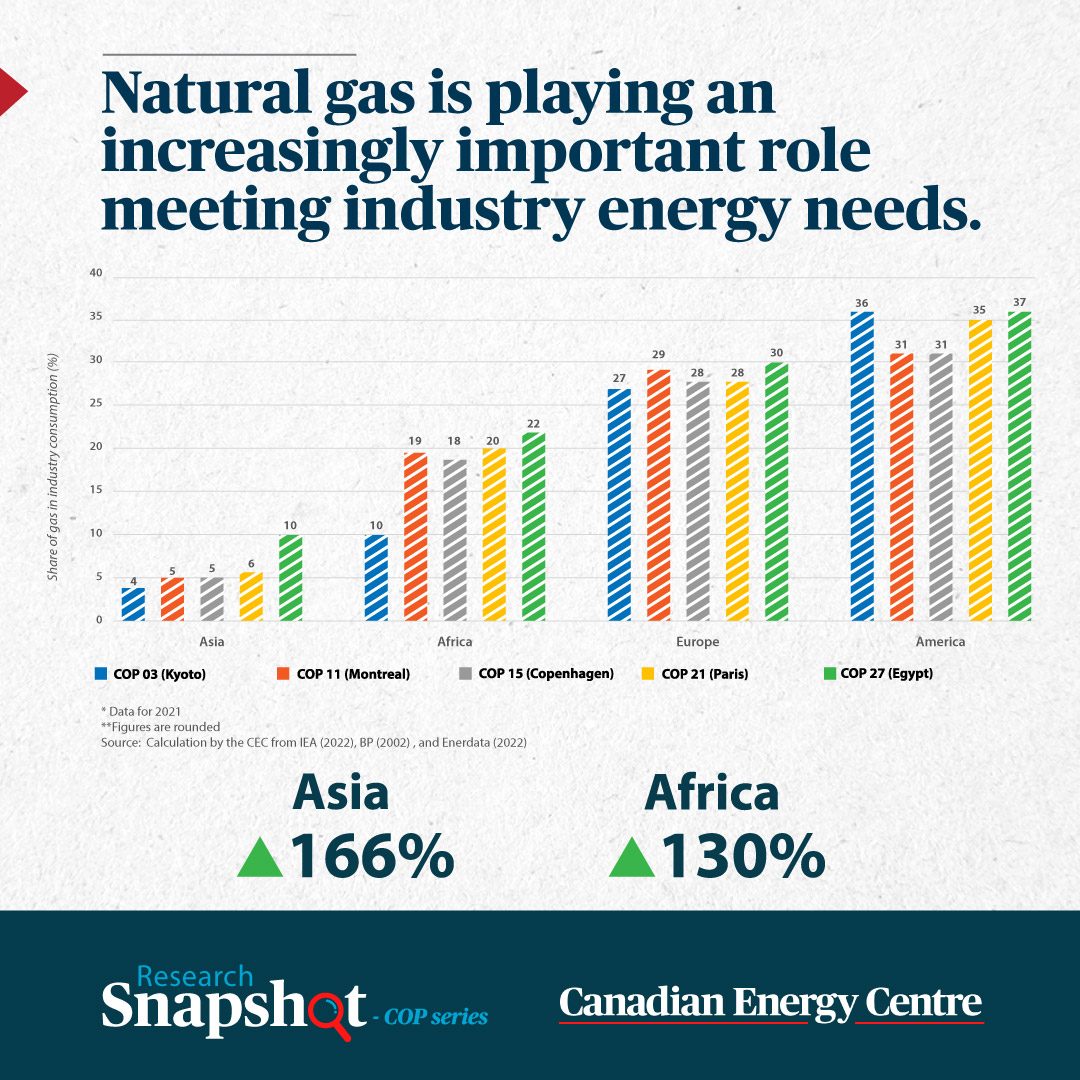
Natural gas is playing an increasingly important role in meeting industry energy demand around the world. Natural gas is integral to developing economies in Asia. Since the Kyoto protocol, demand for natural gas across industries in Asia has jumped by 166 per cent.
48.
Canadian LNG and Asian markets
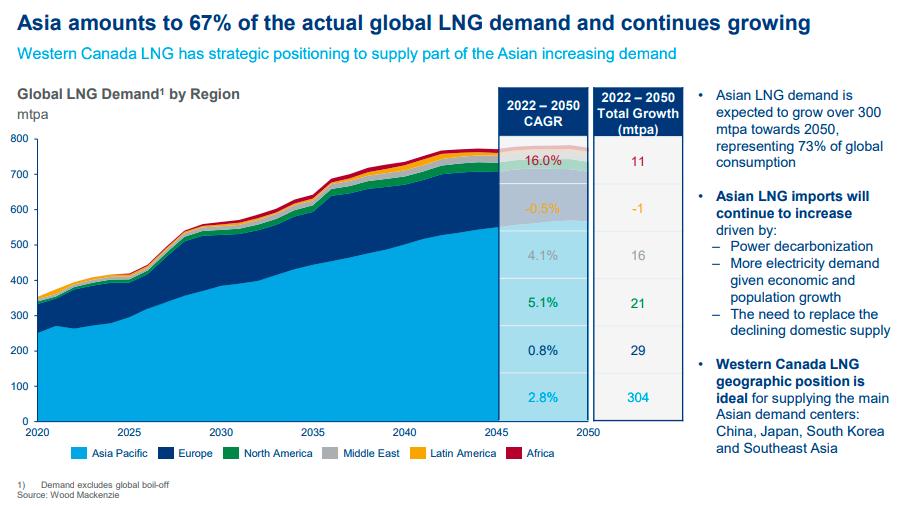
A Wood Mackenzie study, commissioned by the Canadian Energy Centre demonstrates how natural gas from Canada could help energy-hungry Asian countries meet growing demand while at the same time helping lower net global emissions by supplanting coal.¹ Specifically,
- Asia now accounts for more than two-thirds (67 per cent) of global LNG demand, and is expected to grow to 300 million tonnes per annum (mtpa), or about 73 per cent of total global demand by 2050 due to rising economic and population growth, and the need to decarbonize the existing power supply.
- By 2050, energy demand from Asian countries is expected to account for 47 per cent of the global total, with China making up more than half of that.
- A global LNG demand gap of 150 mtpa is anticipated by 2035. If currently planned west coast projects come online by 2035, Canada could provide up to 59 mtpa to help address the shortfall under a scenario in which this country accelerates its LNG capacity.
1. The study examined three scenarios – a base case that considers moderate growth by in Canada’s LNG industry, one in which Canada greatly accelerates its LNG capacity, and one in which it remains largely stagnant.
49.
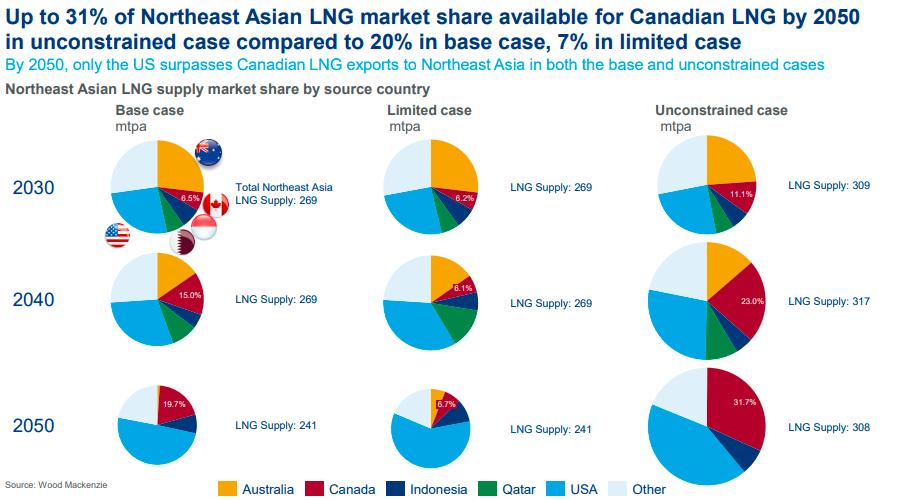
Canadian LNG opportunities
Canada can be a prefererd and reliable supplier of LNG to Northeast Asia. Up to 31 per cent of the Northeast Asian LNG market share is available for Canadian LNG by 2050.
50.
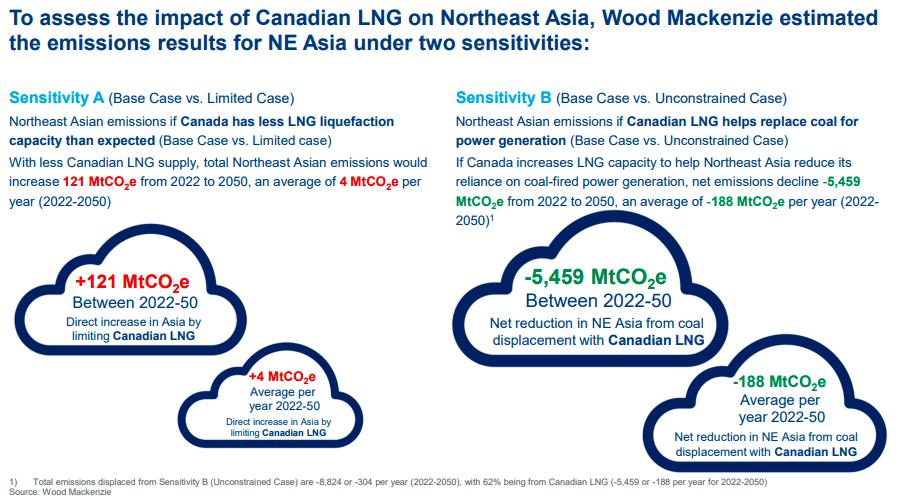
How Canadian LNG exports can reduce global emissions
If Canada increases its LNG export capacity to Asia, by 2050 net emissions could decline by 188 million tonnes of CO2 equivalent per year – or the annual impact of taking 41 million cars off the road.

CEC Research Briefs
Canadian Energy Centre (CEC) Research Briefs are contextual explanations of data as they relate to Canadian energy. They are statistical analyses released periodically to provide context on energy issues for investors, policymakers, and the public. The source of profiled data depends on the specific issue. This research brief is a compilation of previous Fact Sheets and Research Briefs released by the Centre in 2020. Sources can be accessed in the previously released reports. All percentages in this report are calculated from the original data, which can run to multiple decimal points. They are not calculated using the rounded figures that may appear in charts and in the text, which are more reader friendly. Thus, calculations made from the rounded figures (and not the more precise source data) will differ from the more statistically precise percentages we arrive at using the original data sources.
About the authors
This CEC Research Brief was compiled by Lennie Kaplan, Executive Director of Research, and Ven Venkatachalam, Chief Research Analyst, Canadian Energy Centre.
Creative Commons Copyright
Research and data from the Canadian Energy Centre (CEC) is available for public usage under creative commons copyright terms with attribution to the CEC. Attribution and specific restrictions on usage including non-commercial use only and no changes to material should follow guidelines enunciated by Creative Commons here: Attribution-NonCommercial-NoDerivs CC BY-NC-ND.
