Social
To sign up to receive the latest Canadian Energy Centre research to your inbox email: research@canadianenergycentre.ca
Download the PDF here
Download the charts here
Executive Summary
The carbon tax is a policy instrument intended to curb greenhouse gas emissions (GHGs). However, there has been concern over the impact of the carbon tax on industry costs and competitiveness. The carbon tax makes producers pay for their emissions. The problem arises when there is no uniform carbon policy across international markets.
Differences between countries in their approach to lowering carbon emissions will impose higher costs on industries in some jurisdictions or see industries relocate to lower-cost regions such as the United States (possibly leading to “carbon leakage”).
This study analyzes the impact of the carbon tax in Ontario. The analysis shows that introducing the $170 per tonne carbon tax will increase industry business costs. Companies in the province could see their profits fall as their business costs increase. Businesses will also find it difficult to pass on the cost increases associated with a carbon tax to customers.
In Ontario, goods-producing industries such as mining, utilities, iron and steel, manufacturing, motor vehicles, and chemical manufacturing, which generally have higher energy input requirements than other industries will bear the highest impact of the carbon tax.
Companies in fabricated metal and plastic and in rubber products will face a significant impact from the carbon tax due to their high exposure to trade competition from similar industries in other jurisdictions that have less stringent rules.
Introduction
Ontario is a significant contributor to Canada’s GDP. In 2021, Ontario’s nominal GDP was approximately $957 billion, about 38 per cent of Canada’s total GDP (see Figure 1). Of all the provinces, Ontario creates the largest share of Canada’s GDP. Ontario’s many industries contribute significantly to the Canadian economy. Consequently, industries, consumers, and policymakers across Ontario are paying increasing attention to the implementation of carbon taxes.
In 2018, Canada’s federal government implemented a nationwide carbon tax as one tool to reduce carbon emissions. The carbon tax is now affecting and will continue to affect nearly all Canadian taxpayers, regardless of who bears the initial cost of the tax. As such, businesses in all provinces need to be informed about the carbon tax and participate in conversations about its impact.
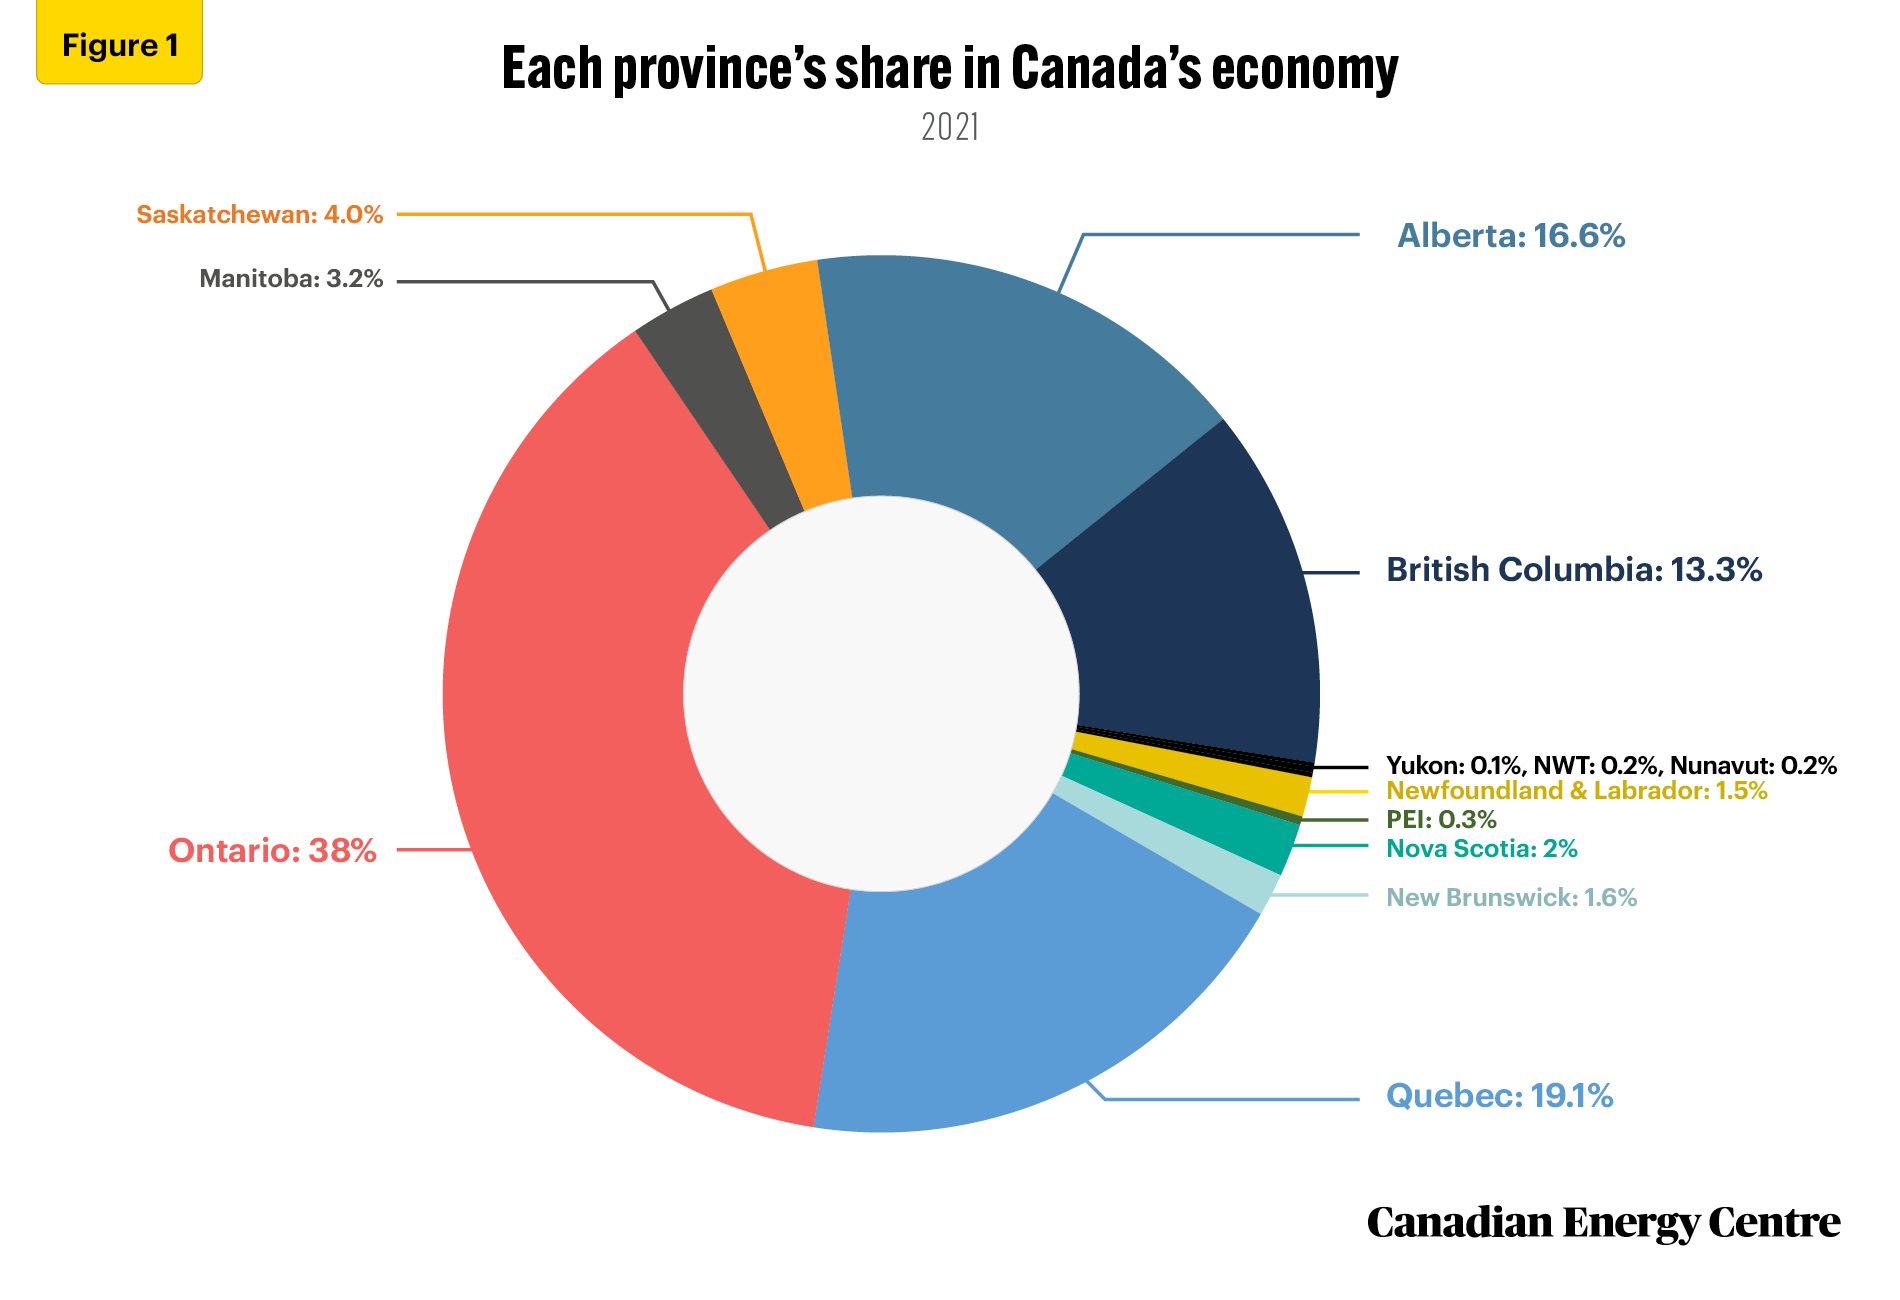
Source: Statistics Canada, Table 36-10-0402-02
As debate continues among Ontario’s policymakers about the costs and benefits of the carbon tax, this study looks at the potential impact of a $170 per tonne carbon tax on various industries in the province.¹ The analysis provides a general overview of the potential impact of the carbon tax on production costs for a particular sector; because each business organization is unique, businesses need to complete analyses specific to their business models and based on their suppliers, competitors, customers, and markets. Studies conducted with different methodologies and assumptions will calculate different estimates of the impact of the carbon tax on business.
The CEC is undertaking this carbon tax impact study because such information will be helpful for all industry stakeholders. Many organizations and authors have studied the impact of the carbon tax on households (Ammar et al., 2022) and businesses (McKitrick and Aliakbari, 2021). The current study contributes to the discourse by calculating the impact of the carbon tax on industry costs.
The rest of the paper is organized as follows. Section 2 provides a brief overview of carbon tax legislation in Canada and Ontario. Section 3 examines the impact of the carbon tax on business costs. Section 4 provides information on the province’s sectoral share of industry GDP and carbon emissions. Section 5 examines the impact of the carbon tax across various Ontario business sectors. Section 6 combines the carbon tax impact on production costs, industry profits, and trade exposure to identify industries that may face the most competitive pressures due to the implementation of the tax. The paper concludes by summarizing the implications of the carbon tax on the competitiveness of several different sectors.
1. In this Research Brief, we use customized data from Stokes Economics to examine the impact of the carbon tax on industry production costs. The CEC retained Stokes Economics to estimate the additional costs industries will incur from the carbon tax. The estimated impact on industry costs from carbon taxes presented in this analysis focuses solely on pricing fuel emissions subject to federal carbon tax
Carbon Tax Legislation
As part of the 2016 Pan-Canadian Framework on Clean Growth and Climate Change, the government of Canada passed the Greenhouse Gas Pollution Pricing Act (GGPPA) in December 2018. The GGPPA imposes a carbon pricing system on provinces and territories that either have not implemented their own carbon pricing system or have implemented a system that does not meet the minimum requirements set by the federal government.
According to the government of Canada (Undated), the GGPPA consists of two parts: a regulatory charge on fuels such as gasoline and natural gas (known as the fuel charge) and a performance-based baseline and credit system for large industrial emitters that meet prescribed criteria set out in the GGPPA and its regulations, known as the Output-Based Pricing System (OBPS).
Federal and provincial governments have the constitutional authority to regulate climate change policy, which affects how policy has been developed in Ontario.² Ontario uses the federal carbon tax (for fuel emissions) and the Emission Performance Standards (for industrial emissions) as its policy instruments to regulate greenhouse gas (GHG) emissions.
Under the GGPPA, the federal carbon tax began at $20/tonne in 2019 and escalated by $10 per year to $50/tonne in 2022. In December 2020, the federal government released an updated plan with a $15/tonne per year increase in the carbon price, which is to reach $95/tonne in 2025 and $170/tonne in 2030.
2. Federal and provincial governments in Canada share jurisdiction on environmental regulations in accordance with the Canadian Constitution Act, 1867, which did not assign jurisdiction over the environment to either the provincial or federal governments. Environmental laws are diffuse and can be addressed under federal or provincial legislative power depending upon the nature and scope of the issue. Federal environmental initiatives can be regulated through Parliament using the various laws it has at its disposal. Provincial environmental legislation is supported under the power granted to provinces to regulate land and business through provincial property and civil rights, and in provincial power delegated to municipalities (Becklumb, 2019: 2).
Carbon Taxes and Businesses Costs
One of the main ways in which the federal government’s carbon tax will influence a company’s operations is through increased energy costs for businesses. The carbon tax makes gasoline and natural gas and electricity generation more expensive.
Industry cost impacts from a direct fuel charge are primarily determined by the amount and type of fuel businesses use in their production processes. As such, to interpret the cost impacts accurately, it is essential to understand the energy mix used in each specific industrial production process.
The carbon tax is a tax on the factors of production (i.e., labour, capital, and intermediate inputs). Intermediate inputs are goods and services (such as energy) used in producing goods and services.
The carbon tax will raise the intermediate input cost and thereby increase production or business costs.
Intermediate input costs play an essential role in most businesses, affecting the final price at which goods and services will be sold to customers, which in turn has an effect on the business’s profitability.
Electricity use (one intermediate input) is an essential consideration in calculating the costs of industrial production. Its cost impact will vary based on the mix of energy sources used to generate electricity in a particular region. This distinction is evident when comparing the cost impacts across industries. Provinces that use a higher share of coal, natural gas, or refined petroleum products (RPPs) to generate electricity will face a relatively higher cost impact.
Ontario’s input costs will be lower than for some other provinces as it generates a higher share of its electric power from nuclear. In 2022, Ontario generated 151,352 (GWh) of electricity, 59 per cent of which came from nuclear energy (see Figure 2).

Source: Canada Energy Regulator (Undated)
The carbon tax will give rise to both direct and indirect business costs. Energy-intensive industries will incur more of the former and other industries more of the latter. Direct impacts are the cost that the carbon tax will impose on carbon-emitting sectors and the cost of fuel or energy used directly in production.
Indirect costs are the carbon tax-induced costs the business will incur through input or production processes subject to the carbon tax in the prior production stage. Industries such as food services and restaurants, financial services, or retail stores that are not subject to the tax directly may still experience significant cost increases if the sector relies on inputs that use energy-intensive production processes.
Carbon taxes have two effects on industries. First, the carbon tax is applied to refineries, utility companies, and other intermediaries that supply electricity, fuel, and other energy that industries use. The tax then translates into higher fuel prices, which in turn increases input costs for other industries. Second, because the carbon tax increases those input prices, there is a long run reduction in industrial output.
The carbon tax can affect the profitability³ of companies because increased production costs cannot always be passed on to consumers. Further, the carbon tax will particularly affect industries that are trade exposed.⁴ A producer that tries to raise prices will be less competitive in export markets and may well lose market share to imports in domestic market.
As corporate tax incidence studies have shown, in a small open economy like Ontario, much of the tax on business costs can be passed back to labour and capital, especially labour bearing much of the cost of the tax (McKenzie and Ferede, 2017).
The carbon tax effect is most pronounced in two types of trade-exposed industries: those that are sensitive to import competition and those that export most of their products. Trade-exposed industries face a unique challenge: the prices of the goods the industries produce are set in the global markets.
Without the ability to pass some portion of their increased production costs on to buyers, trade-exposed industries must pay that portion of the cost themselves, thereby affecting their profitability. As all of Canada is subject to carbon pricing through the fuel charge or a cap-and-trade system, cost competitiveness concerns lie solely with similar companies operating in jurisdictions that have access to other international trading partners.
3. The term “profit” means the operating surplus generated through the production of goods and services in the industry and includes pre-tax profits and the value of depreciation.
4. Trade exposure indicates the capacity of the company to transfer the carbon cost imposed on it to its customers. Only the company knows its capacity to transfer its costs to the customer. “Trade exposure” is a theoretical concept; the higher a sector’s trade exposure, the more difficult it will be for the company to transfer the cost. The trade exposure ratio is: (Exports + Imports) / (Domestic production + Imports).
Ontario’s Economy and its Sources of Energy-Related Emissions
The first step in analyzing the impact of the carbon tax is to examine the provincial economy and calculate its sectoral share of provincial gross domestic product (GDP) and its sources of GHGs.
Table 1 shows the GDP share of various sectors in Ontario’s economy. Manufacturing comprises 11.0 per cent of Ontario’s GDP; the construction sector 7.9 per cent; finance, insurance, and real estate 22.6 per cent; and agriculture 1.1 per cent (see Table 1).

Source: Statistics Canada, Table 36-10-0400-01
Ontario’s total GHG emissions were 150.6 megatonnes (MT) of carbon dioxide equivalent (CO2e) in 2021, 22 per cent of Canada’s 670.4 MT of CO2e emissions that year.
As Table 2 shows, greenhouse gas emissions in the province are primarily concentrated in a few types of economic activities. The transportation sector accounts for 34.8 per cent of all GHG emissions; industrial activity, including manufacturing, accounts for 24.8 per cent of the province’s GHG emissions.
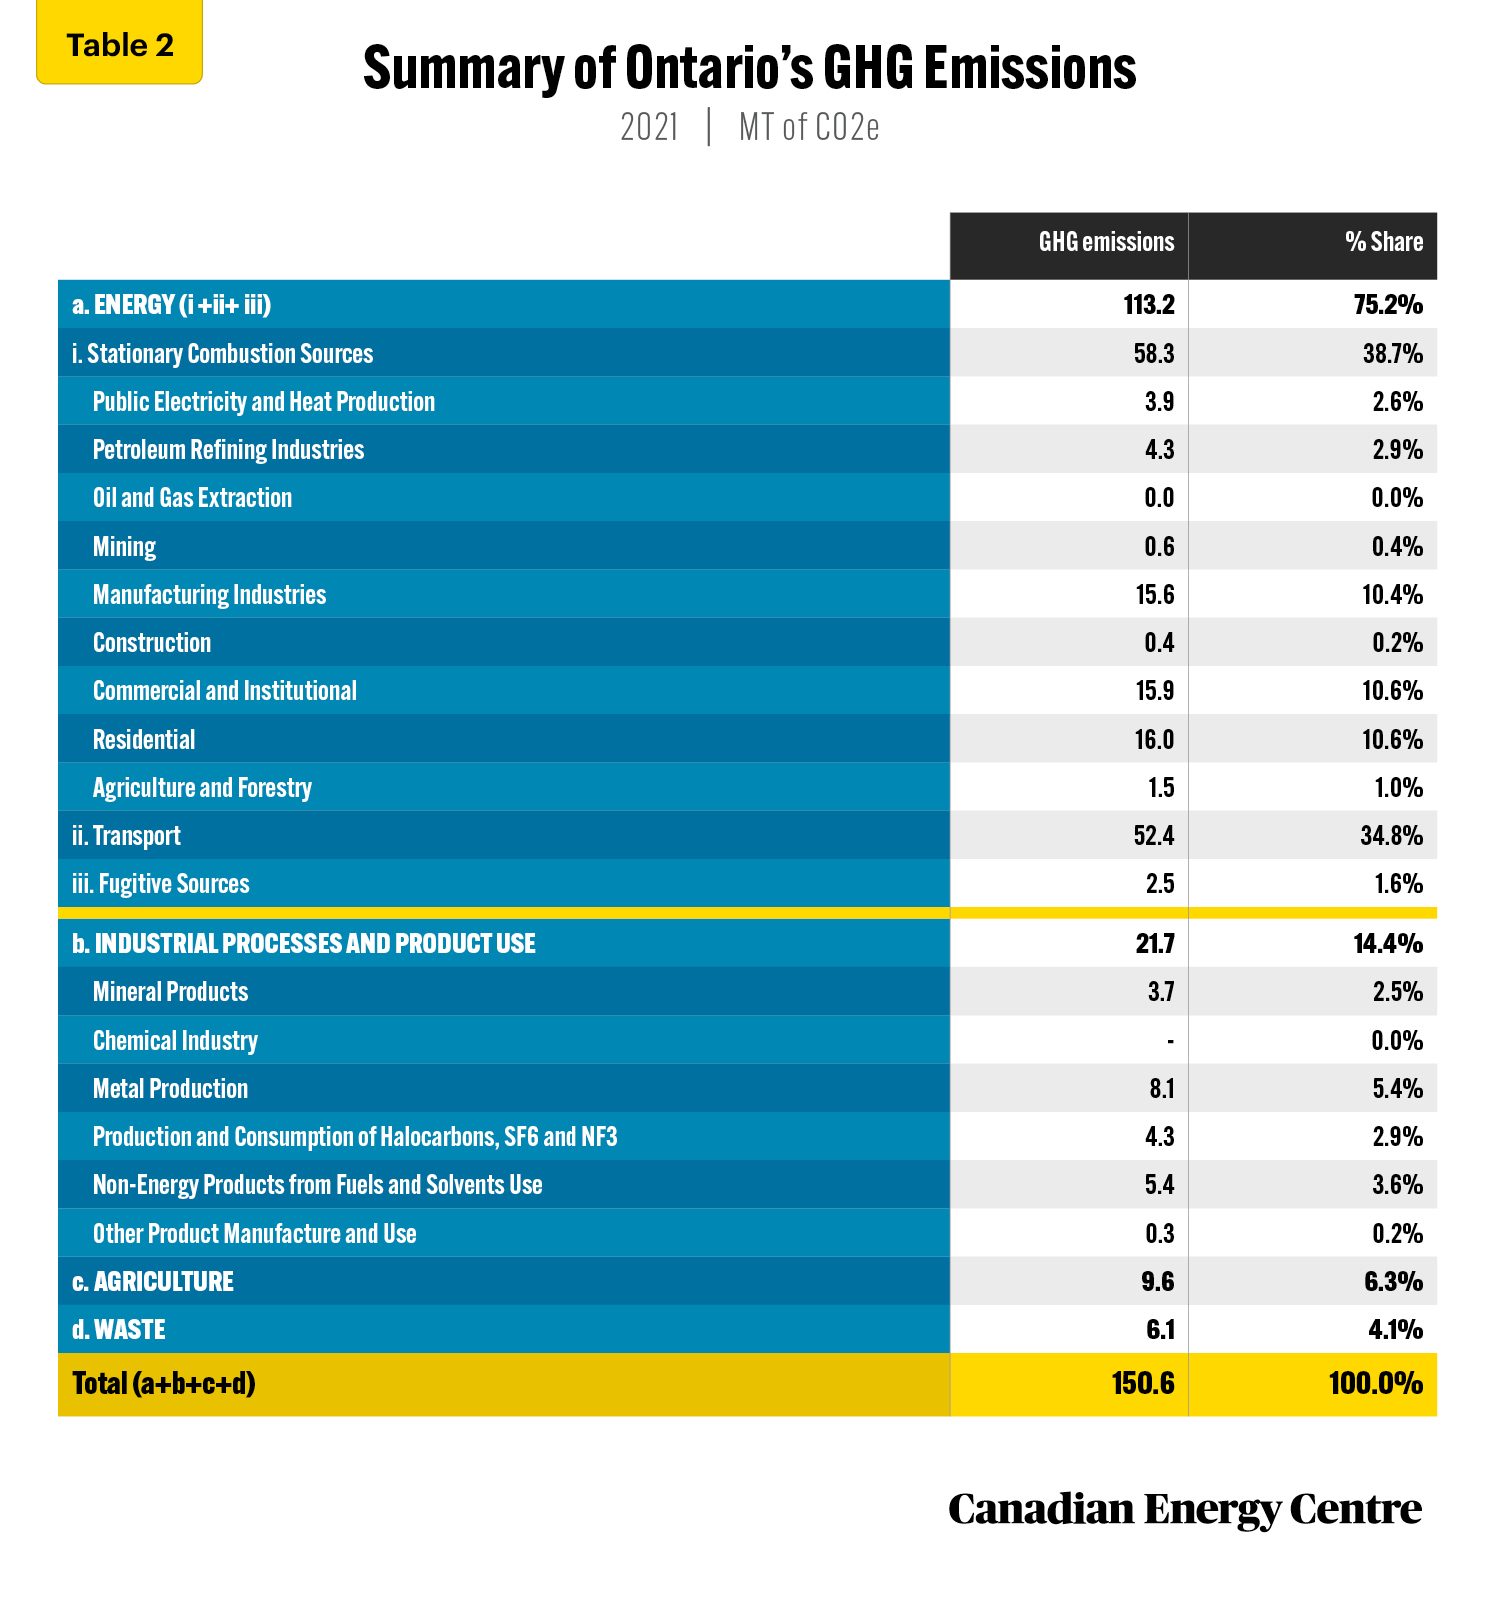
Source: Environment and Climate Change Canada (2023)
Estimated Impact of the Carbon Tax on Industry Production Costs
Primary sector
The production of goods and services necessitates businesses input costs which include capital, goods, services, energy, wages, and salaries. In Ontario’s agriculture sector, 6.7 per cent of production costs are for energy; in the forestry sector, energy accounts for 7.7 per cent of production costs.
Both sectors use a combination of diesel, biodiesel, and gasoline to supply their energy inputs. Fuels used in farming activities are mainly exempt from the carbon tax, so increased costs for the sector arise when other industries’ costs are pushed onto the sector as happens with inter-industry demand and supply linkages. As a result of those cost increases, the primary sector in Ontario will
its production cost increase by 4.3 per cent.
Forestry and logging in the province will see a cost increase of 5.0 per cent on average. Support activities for mining are energy-intensive, with its energy inputs exceeding 5.0 per cent. Its heavy use of refined petroleum will see the industry experiencing a 4.4 per cent cost increase due to the carbon tax (see Figure 3).

Source: Derived from custom data provided by Stokes Economics
Utilities and construction sector
On average, production costs will increase by more than 10.0 per cent in the utilities industry. Ontario’s electric power generation, transmission, and distribution sector will see a cost increase of almost 11.8 per cent due to the carbon tax. (Electric power generation uses natural gas in the generation mix, which accounts for 5.8 per cent of the industry’s inputs) (see Figure 4).

Source: Derived from custom data provided by Stokes Economics
Manufacturing sector
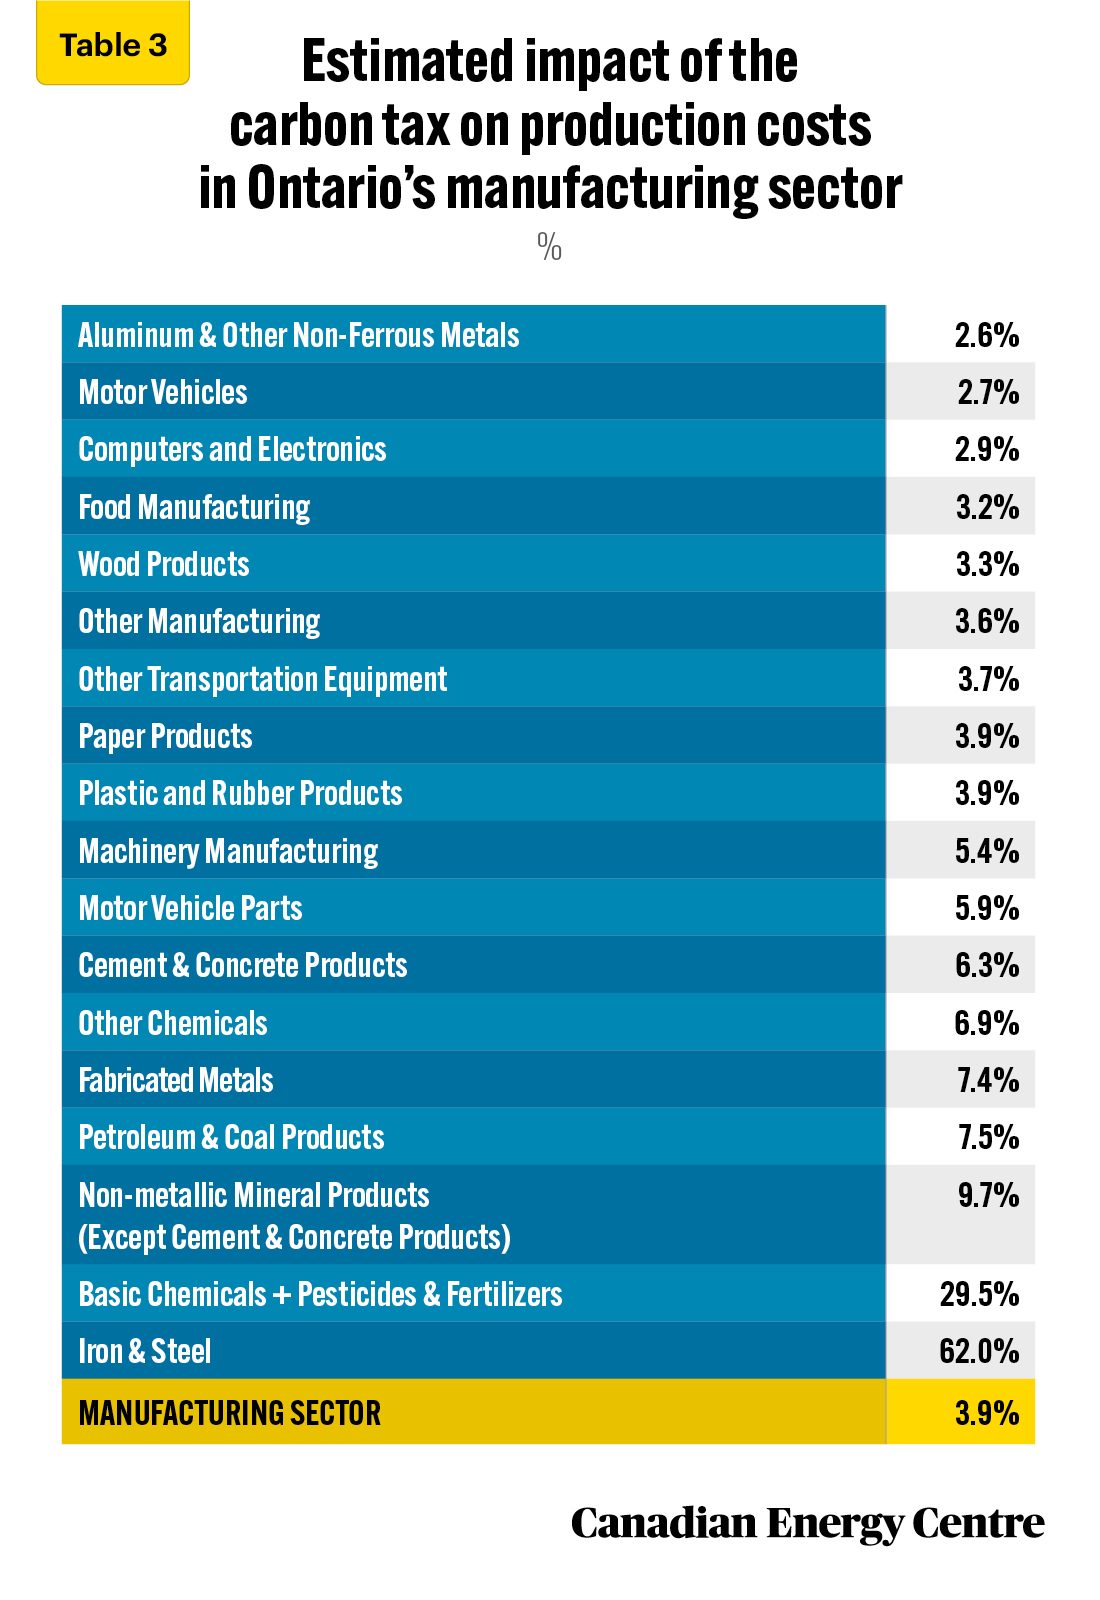
At 62 per cent, iron and steel manufacturing will see the highest cost increase of all industries from the carbon tax (see Table 3). This increase is predominantly due to the industry’s high use of energy inputs, which include coke and coal, and account for 8.6 per cent of total inputs in the industry.⁵
Another energy-intensive industry is basic chemicals, pesticides and fertilizers, and other agricultural chemical products. It will see costs rise 29.5 per cent due to the carbon tax (see Table 3), mainly due to its use of natural gas, which accounts for 13 per cent of this industry’s inputs, though its use of electricity also affects the tax it will pay.
While most iron and steel manufacturing occurs in Ontario (accounting for just over 70 per cent the sector’s contribution to Canada’s GDP), iron and steel products (at just 2.5 per cent) and basic chemicals, pesticides and fertilizers, and other agricultural chemical products (at 1.7 per cent) make up a small portion of the total manufacturing industry in the province.
The larger manufacturing sub-industries, which include food products, other chemical products, machinery, motor vehicles, and motor vehicle parts, will see their costs increase from just under 3 to nearly 7 per cent from the carbon fuel tax. Food manufacturing costs will increase by 3.2 per cent under a carbon tax charge (see Table 3) owing to the sub-sector’s energy input share of 1.6 per cent.
Motor vehicle manufacturing has a relatively low energy input share (0.3 per cent) but will be hit by costs passed on from other inputs such as iron and steel. The industry will see its costs increase by 2.7 per cent. On the other hand, motor vehicle parts costs will increase by 5.9 per cent. Overall, production costs for the manufacturing sector as a whole will increase by more than 3.9 per cent (see Table 3).
5. Investment that would reduce the industry’s reliance on coke and coal products in the steel-making process at facilities in the province could lessen emissions and in turn reduce the carbon taxes it will otherwise have to pay. However, the upfront capital costs of those investments would also have to be factored in.
Source: Derived from custom data provided by Stokes Economics
Service sector
In Ontario’s service sector, the transportation and warehousing sub-sector, which relies heavily on refined petroleum products, will see the highest cost increases from the $170 per tonne carbon tax (6.3 per cent). The accommodation and food industry will see costs rise by 3.2 per cent, and the retail industry will see costs increase by 3.9 per cent (see Figure 5).
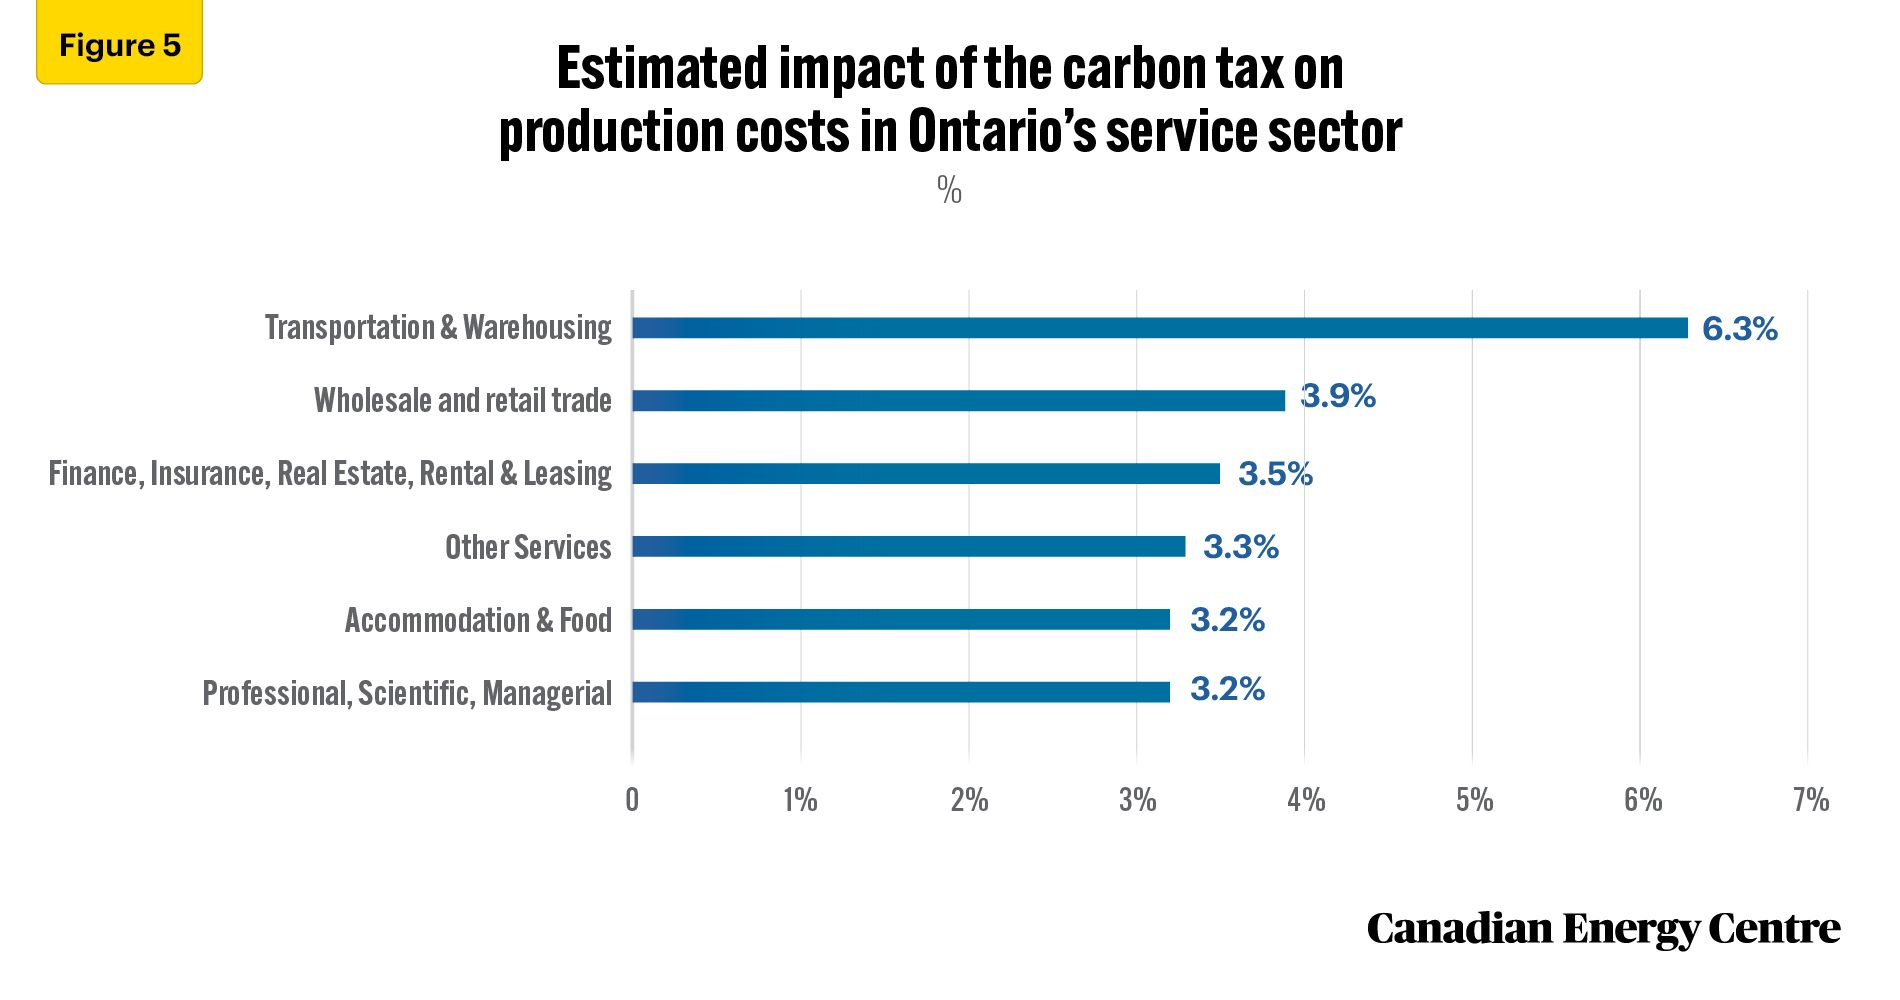
Source: Derived from custom data provided by Stokes Economics
The Cost of the Carbon Tax on the Competitiveness of Ontario’s Manufacturing Sector
The carbon tax will affect the profitability of many industries in the manufacturing sector. Transportation equipment (comprising 16 per cent of manufacturing GDP), basic chemical manufacturing (10 per cent of manufacturing GDP), computer and electronic product manufacturing (4 per cent of manufacturing GDP), and paper manufacturing (2 per cent of manufacturing GDP) are the province’s most significant manufacturing industries, together accounting for around 30 per cent of the sector’s output.
Figure 6 combines the impact of the carbon tax on production costs, industry profits, and trade exposure in order to identify industries that will face the most competitive pressures from the implementation of the tax. The carbon tax will have the most significant impact on those industries in the manufacturing sector that have a high trade exposure and a low-profit margin.⁶
Industries with low-profit margins in manufacturing sector, such as motor vehicle, will face a significant impact from the carbon tax. Similarly, as Figure 6 indicates, the impact of the carbon tax will be very evident in manufacturing sectors with high or very high trade exposure such as fabricated metals, plastic and rubber products, basic chemicals, computers and electronics, and transportation equipment.
The increased business costs arising from the $170 per tonne carbon tax will significantly affect the manufacturing industry, particularly sub-sectors with lower profit margins and high trade exposure. Industries with lower profit margins will find it challenging to absorb the cost increase brought on by the carbon tax. Profit margin is critical to a free market economy. The margin must be high enough compared to similar businesses to attract investors. If profit margins are not high enough, companies will leave the sector.
6. Profit margin is the ratio of the industry’s profit (gross operating surplus and gross mixed income) to gross output (total production). Gross output measures sales or revenue from production for most industries. However, it is measured as sales or revenue less the cost of goods sold for margin industries like retail and wholesale trade. For example, if an industry has a profit margin of 5 per cent, this means that for every $100 the product is sold for, the industry makes $5.00 profit.
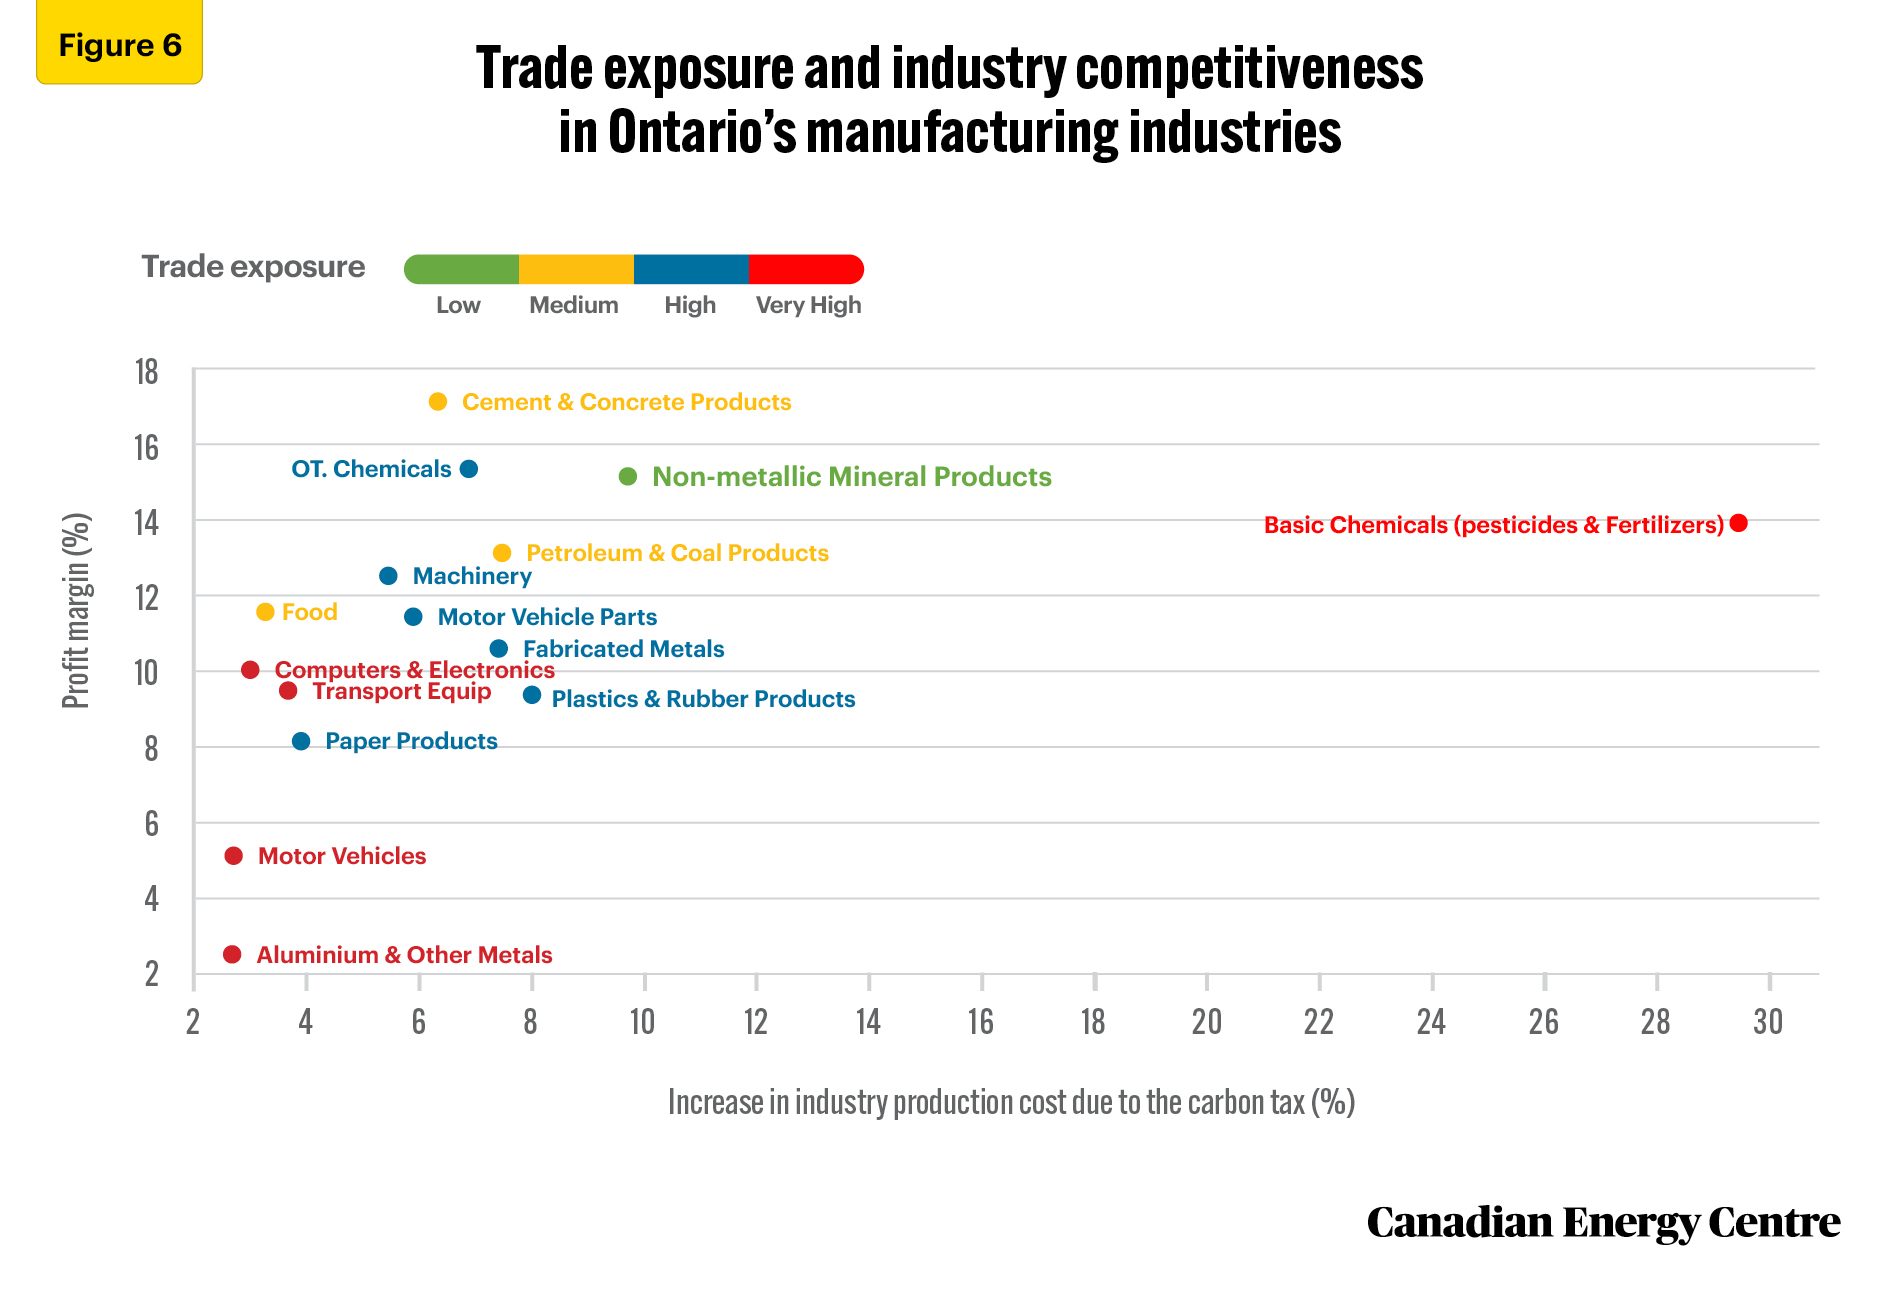
Source: Derived from custom data provided by Stokes Economics
Conclusion
This study has analyzed the impact of the carbon tax across various industries in Ontario. Our study shows that introducing the $170 per tonne carbon tax will increase business costs for the province’s industries. Companies in Ontario could see their profits fall. Businesses will also find it difficult to pass on the cost increase associated with a carbon tax to customers.
The design of the output-based pricing system is intended to mitigate this impact by targeting energy-intensive and trade-exposed industries and setting individual facility or industry emission limits for them. Nonetheless, as this Research Brief has shown, there is no doubt that industries in Ontario will face additional costs associated with the $170 per tonne carbon tax, which will affect industry cost competitiveness.
Each business must determine how the carbon tax will apply to its specific business environment and its impact on stakeholders, employees, customers, and owners. For all of them, however, there is likely to be some impact from the imposition of a $170 per tonne carbon tax.
Appendix
About the estimates: Impact of the carbon tax on production costs
Stokes Economics provided macroeconomic cost projections of the impact of the carbon tax on various industries. Stokes Economics uses a provincial macroeconomic modelling system known as “PROVMODS” to estimate the impacts of the carbon tax on industry costs. The estimated impact on industry costs from carbon taxes presented in this analysis focuses solely on pricing fuel emissions subject to provincial and federal carbon taxes either directly through a fuel charge, or indirectly through a cap-and-trade system.
To quantify the impact of carbon pricing, the model uses a “base case” forecast that includes the carbon price beginning at $50 per tonne in 2022 and escalating to $170 per tonne by 2030. Next, the model creates an alternate scenario where the carbon tax is immediately repealed in 2023 and remains cancelled in all future years. The two scenarios are compared for industry costs and other economic impacts. As various aspects of the carbon pricing system must be accounted for, the selected model is multi-faceted in its features and capabilities.
Limitations
This analysis focuses solely on the cost implications associated with the fuel charge component of the carbon tax. Large industrial emitters subject to the output-based pricing system (OBPS) may incur additional costs if their facility doesn’t meet emission standards set under that program. These potential costs are not included in the results presented in this analysis. Also, the analysis doesn’t include the impact of clean fuel standards.
The model relies on the relative aggregate industry data that masks heterogeneity across firms in the industry. The model assumes that the carbon tax is an input cost and not a fixed cost in production, and that the average cost is equal to the marginal cost reflecting the long-run absence of economies or diseconomies of scale. The estimates do not consider input substitution among factors of production (energy, land, labour, and capital). Moreover, the study does not consider how the revenue from the carbon tax will be recycled to various industries through cuts in other taxes or taxes on input production. This analysis does not assume changes in production technology or fuel switching in industrial production processes due to the carbon fuel charge. The model ignores different manufacturing processes used in various industries. Different manufacturing processes can lead to a different industry fuel mix and energy use.
CEC Research Briefs
Canadian Energy Centre (CEC) Research Briefs are contextual explanations of data as they relate to Canadian energy. They are statistical analyses released periodically to provide context on energy issues for investors, policymakers, and the public. The source of profiled data depends on the specific issue.
About the authors
This CEC Research Brief was compiled by Ven Venkatachalam, Chief Research Analyst, Canadian Energy Centre, and Lennie Kaplan, Executive Director of Research, Canadian Energy Centre. The authors and the Canadian Energy Centre would like to thank and acknowledge the assistance of Stokes Economics and two anonymous reviewers in reviewing the data and research for this Research Brief
References (All links live as of July 16, 2023)
Ammar, Nasreddine, Philip Bagnoli, Krista Duncan, and Tim Scholz (2022). A Distributional Analysis of Federal Carbon Pricing under A Healthy Environment and A Healthy Economy. Canada, Parliamentary Budget Officer (PBO). https://distribution-a617274656661637473.pbo-dpb.ca/6399abff7887b53208a1e97cfb397801ea9f4e729c15dfb85998d1eb359ea5c7
Becklumb, Penny (2019). Federal and Provincial Jurisdiction to Regulate Environmental Issues. Background Paper. Canada, Library of Parliament, Economics, Resources and International Affairs Division. https://lop.parl.ca/sites/PublicWebsite/default/en_CA/ResearchPublications/201386E
Canada Energy Regulator (Undated). Macro Indicators. Canada’s Energy Future Data Appendices. Government of Canada. https://apps.rec-cer.gc.ca/ftrppndc/dflt.aspx?GoCTemplateCulture
Environment and Climate Change Canada (2023). National Inventory Report 1990-2021: Greenhouse Gas Sources and Sinks in Canada. Government of Canada. https://publications.gc.ca/site/eng/9.506002/publication.html
Canada (Undated). Carbon Pollution Pricing Systems across Canada. Government of Canada. https://www.canada.ca/en/environment-climate-change/services/climate-change/pricing-pollution-how-it-will-work.html
McKenzie, Kenneth J., and Ergete Ferede (2017). The Incidence of the Corporate Income Tax on Wages: Evidence from Canadian Provinces. SPP Technical Paper 10, 7. University of Calgary, School of Public Policy. https://www.policyschool.ca/wp-content/uploads/2017/04/Incidence-CIT-on-Wages-McKenzie-Ferede.pdf
McKitrick, Ross, and Elmira Aliakbari (2021). Estimated Impacts of a $170 Carbon Tax in Canada. Revised Edition. Fraser Institute. https://www.fraserinstitute.org/studies/estimated-impacts-of-a-170-carbon-tax-in-canada
Environmental Registry of Ontario (2022). Emissions Performance Standards (EPS) Program Regulatory Amendments for the 2023-2030 Period. ERO number 019-5769. Government of Ontario https://ero.ontario.ca/notice/019-5769 Statistics Canada (2023). Table 36-10-0400-01: Gross Domestic Product (GDP) at Basic Prices, by Industry, Provinces and Territories, Percentage Share. Statistics Canada. https://www150.statcan.gc.ca/t1/tbl1/en/tv.action?pid=3610040001
Creative Commons Copyright
Research and data from the Canadian Energy Centre (CEC) is available for public usage under creative commons copyright terms with attribution to the CEC. Attribution and specific restrictions on usage including non-commercial use only and no changes to material should follow guidelines enunciated by Creative Commons here: Attribution-NonCommercial-NoDerivs CC BY-NC-ND.