To sign up to receive the latest Canadian Energy Centre research to your inbox email: research@canadianenergycentre.ca
Download the PDF here
Download the charts here
Overview
Natural gas, as a lower emitting fuel, will play a critical role in meeting rising global energy demand, while transitioning to net zero emissions (NZE). This will require a significant increase in the world production of liquefied natural gas (LNG) from current levels.
Canada can play a role as a secure and reliable supplier of low-emitting natural gas, in the form of LNG, to a world in transition, hungry for natural gas as a fuel source.
How then does the Canadian upstream natural gas sector fare on supply costs among major natural gas producing countries? In this CEC Fact Sheet, we use data drawn from the Rystad Energy UCube to examine historical trends in supply costs for the Canadian natural gas sector versus that of the top natural gas producing nations.
The written content in this report was prepared by the Canadian Energy Centre (CEC) and does not represent the views of Rystad Energy
Background on Rystad Energy UCube,
Rystad Energy is an independent energy research company providing data, analytics, and consultancy services to clients around the globe.
UCube is Rystad Energy’s global upstream database, including production and economics (costs, revenues, and valuations) for more than 80,000 assets, covering the portfolios of more than 3,500 companies.
The UCube data set is used to study all parts of the global exploration and production (E&P) activity value chain, including operational costs, investment (capex and opex), fiscal terms, and net cash flows for projects and companies, both globally and by country (Rystad Energy, 2023).
Explaining cost of supply and average breakeven natural gas price
The cost of supply for the Canadian natural gas sector is the minimum constant dollar price needed to recover all capital expenditures, operating costs, royalties, taxes, and earn a specified return on investment. Supply costs indicate whether the natural gas sector is economically viable (Rystad Energy, 2023).
The weighted average breakeven gas price for the Canadian natural gas sector is the flat real natural gas price, represented as US Henry Hub per thousand cubic feet, at which continued operation of the natural gas sector is commercial, seen from the current year, i.e., the natural gas price required for a positive net present value (NPV), using a 7.5 per cent discount rate (Rystad, 2023).
Canadian natural gas sector breakeven costs fifth lowest among top ten natural gas producing countries
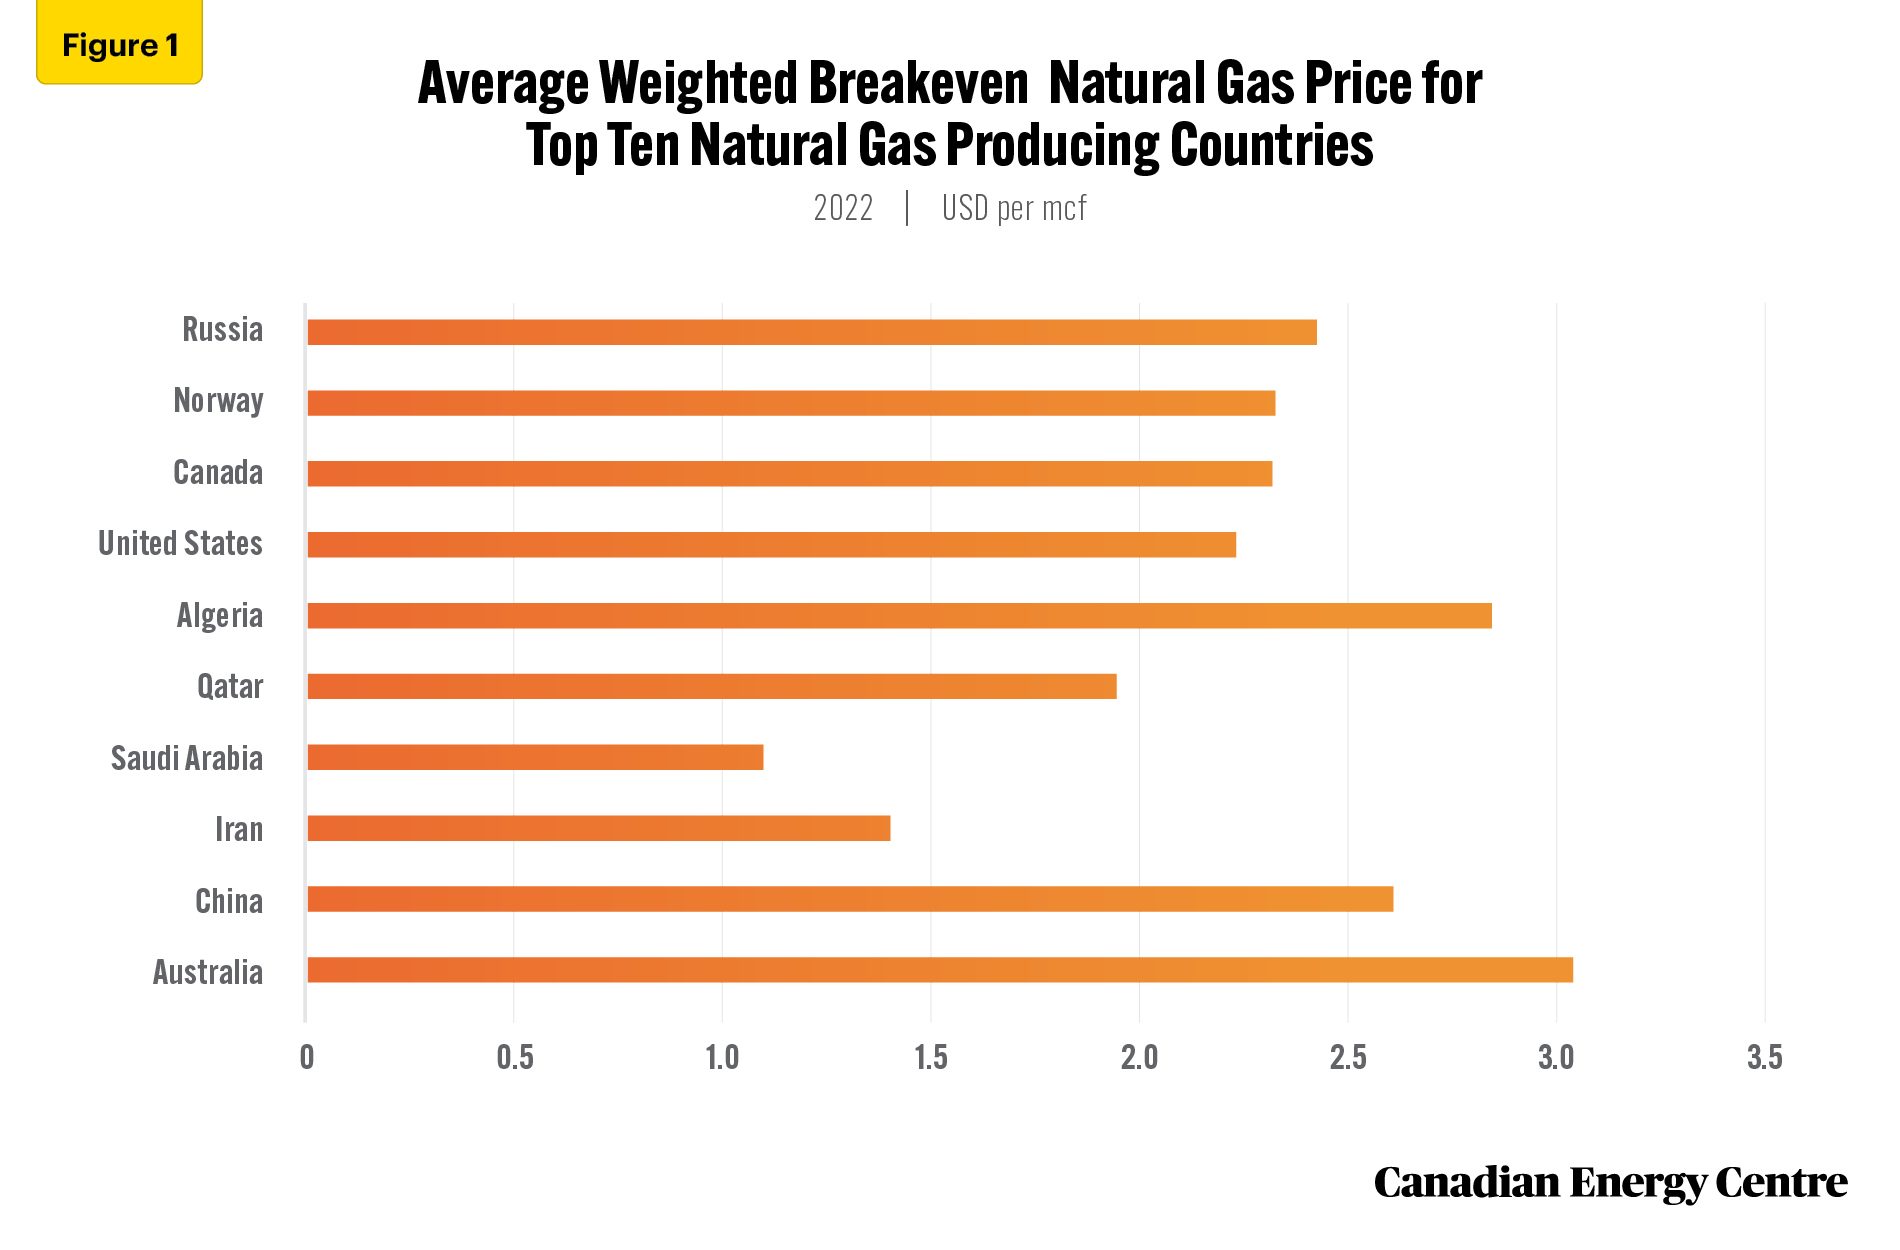
Figure 1 presents average supply costs, expressed as the weighted average breakeven natural gas price, for the top 10 natural gas producing countries, as of 2022. These numbers incorporate producing, under development and discovery phases of natural gas production.
The Canadian natural gas sector had a weighted average breakeven gas price of $2.31 per thousand cubic feet (USD per mcf) in 2022, fifth lowest among major natural gas producing countries, behind Saudi Arabia ($1.09 USD per mcf), Iran ($1.39 USD per mcf), Qatar ($1.93 per mcf) and the United States ($2.22 USD per mcf),
Canadian natural gas sector weighted average breakeven costs in 2022 were lower than Russia, Norway, Algeria, China and Australia (see Figure 1).

Source: Derived from Rystad Energy UCube (2023)
Canadian natural gas sector average returns second highest among major natural gas producing countries
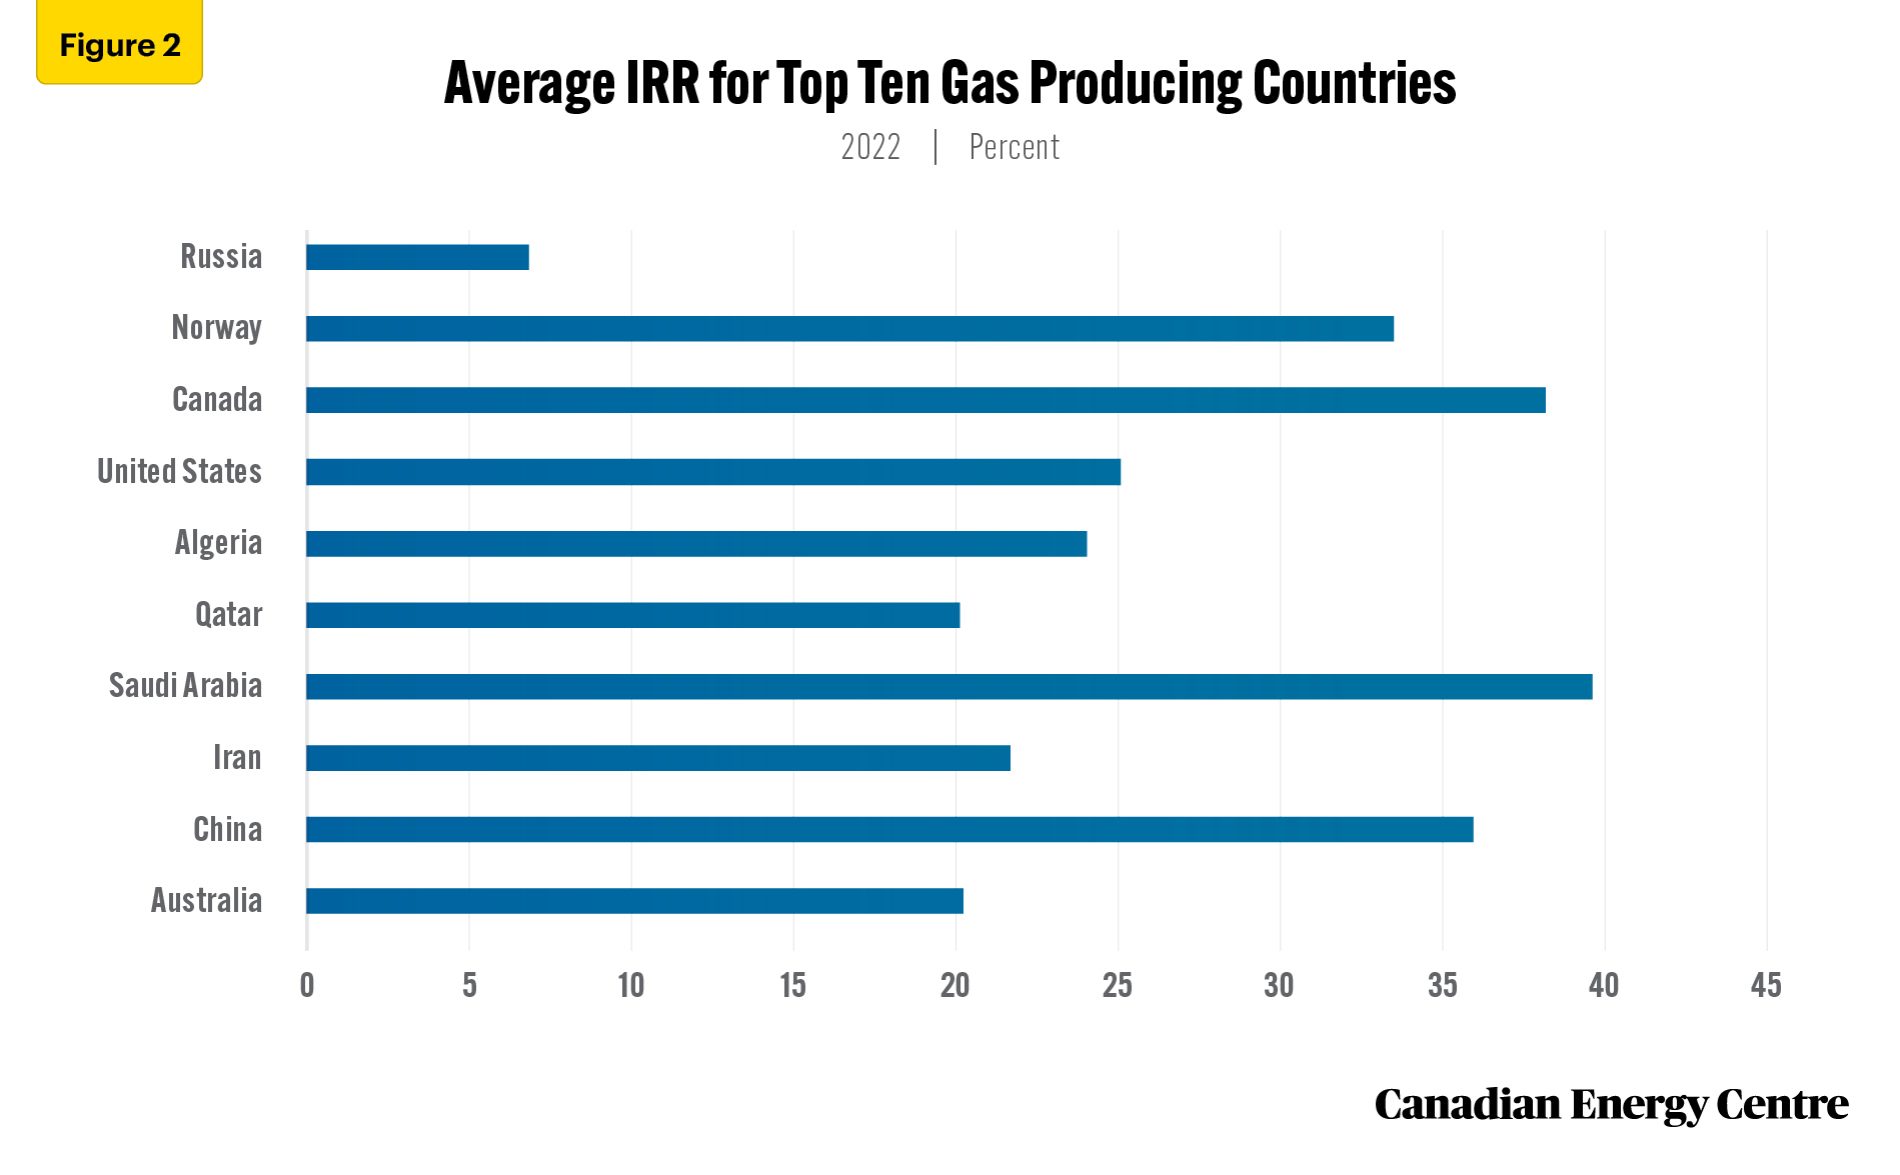
Figure 2 examines the average internal rate of return (IRR) for the top 10 natural gas producing countries, as of 2022.
The average IRR estimates the average maximum discount rate needed to make the net present value (NPV) positive. NPV equals the sum of present values of all cash flows (inflows and outflows) in a project. If the NPV is greater than zero, the project is profitable.
In 2022, the Canadian natural gas sector average IRR at 38.29 per cent was the second highest among major natural gas producing countries, behind only Saudi Arabia (39.73 per cent).
Canada’s natural gas sector average IRR is higher than Russia, Norway, the United States, Algeria, Qatar, Iran, China and Australia (see Figure 2).

Source: Derived from Rystad Energy UCube (2023)
Breakevens for natural gas projects in major Canadian fields are lower than the Canadian average
As noted earlier, the Canadian natural gas sector had a weighted average breakeven natural gas price of $2.31 USD per mcf.
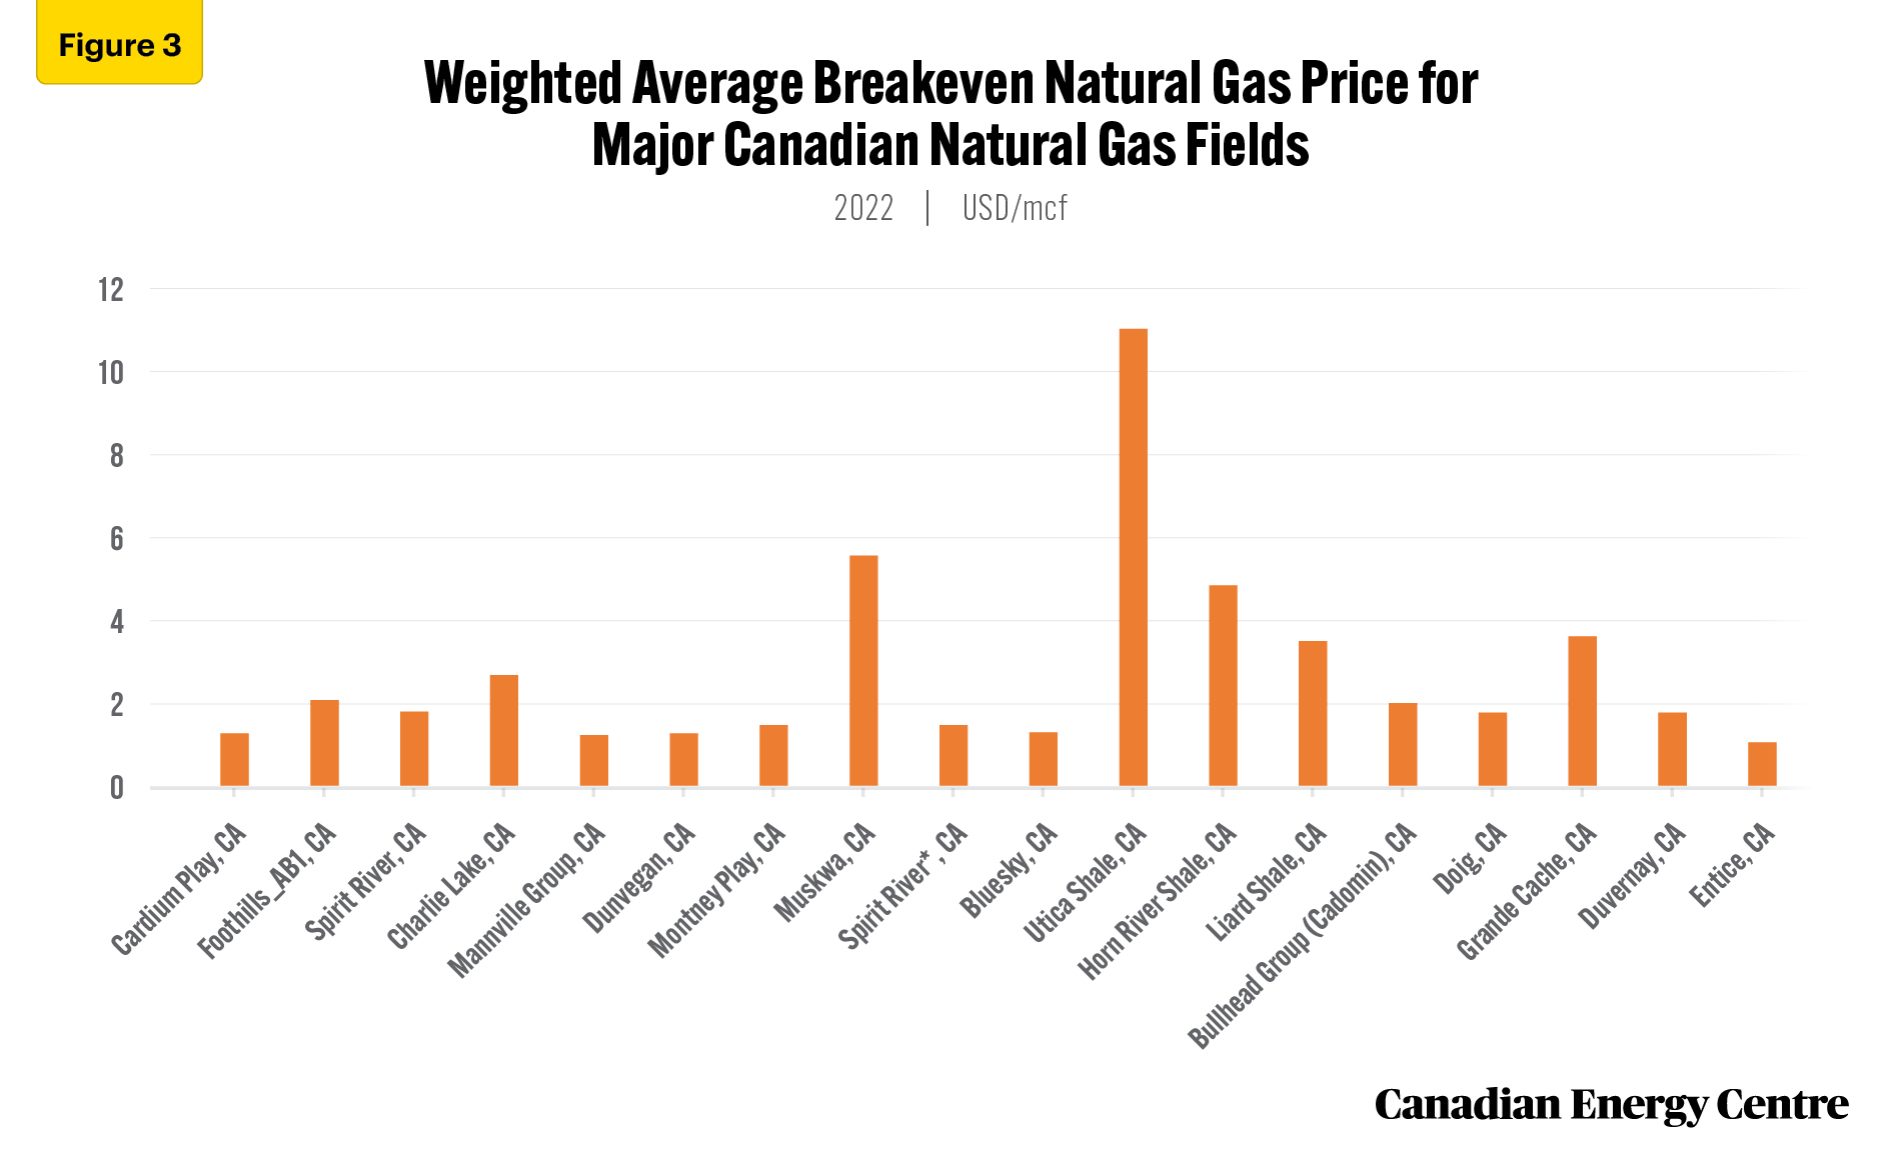
Figure 3 looks at weighted average breakeven gas prices for projects in major Canadian natural gas fields in 2022.
The top natural gas plays in terms of lowest breakeven costs are Entice ($1.06 USD per mcf), Mannville Group ($1.25 USD per mcf), the Cardium Play ($1.29 USD per mcf), Dunvegan ($1.29 USD per mcf), and Bluesky ($1.31 USD per mcf),
Among other prominent natural gas field plays, the Montney Play ($1.49 USD per mcf) and Duvernay ($1.79 USD per mcf) also have weighted average breakeven costs that are well below the Canada-wide average of $2.31 USD per mcf (see Figure 3).

Source: Derived from Rystad Energy UCube (2023)
Conclusion
The Canadian natural gas sector fares very well among major natural gas producing nations on cost of supply.
In 2022, breakevens for Canadian natural gas production average ($2.31 USD per mcf) were fifth lowest among the top 10 major natural gas producing countries, ahead of Russia, Norway, Algeria, Qatar, China, and Australia.
Natural gas plays in such major producing fields such as the Montney Play ($1.49 USD per mcf) and Duvernay ($1.79 USD per mcf) have weighted average breakeven natural gas costs well below the Canada-wide average of $2.31 USD per mcf.
With the inherent advantages of access to low cost feedgas, shorter shipping distances, and a low emissions intensity footprint, Canadian natural gas is well positioned to act as a secure and reliable supplier of LNG to a world where demand for LNG is growing at rapid pace.
Notes
This CEC Fact Sheet was compiled by Lennie Kaplan at the Canadian Energy Centre (www.canadianenergycentre.ca). The author and the Canadian Energy Centre would like to thank and acknowledge the assistance of two anonymous reviewers in reviewing the data and research for this Fact Sheet.
The written content in this report was prepared by the Canadian Energy Centre (CEC) and does not represent the views of Rystad Energy.
Reference (link live as of February 15, 2023)
Rystad Energy UCube. (2023). <https://bit.ly/3veaMIV>.
Creative Commons Copyright
Research and data from the Canadian Energy Centre (CEC) is available for public usage under creative commons copyright terms with attribution to the CEC. Attribution and specific restrictions on usage including non-commercial use only and no changes to material should follow guidelines enunciated by Creative Commons here: Attribution-NonCommercial-NoDerivs CC BY-NC-ND.
