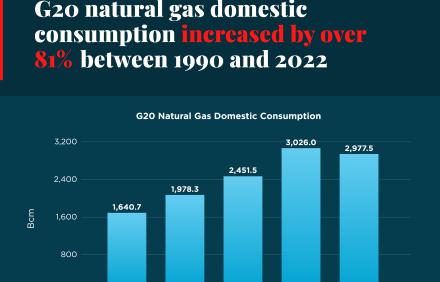
Research Snapshots | October 5, 2023 GRAPHIC: G20 natural gas domestic consumption increased by over 81% between 1990 and 2022
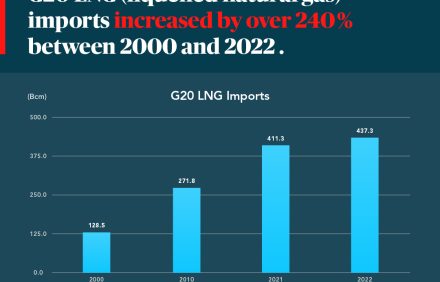
Research Snapshots | October 5, 2023 GRAPHIC: G20 LNG (liquified natural gas) imports increased by over 240% between 2000 and 2022
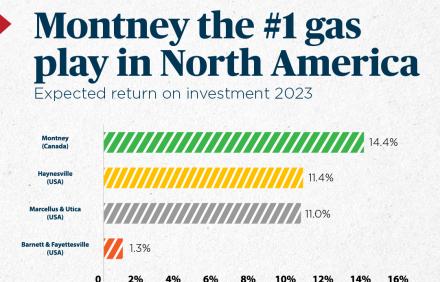
Media Gallery / Research Snapshots | April 21, 2023 GRAPHIC: Montney the #1 gas play in North America
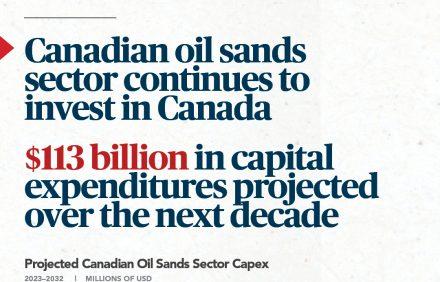
Media Gallery / Research Snapshots | February 6, 2023 GRAPHIC: Canadian oil sands sector continues to invest in Canada
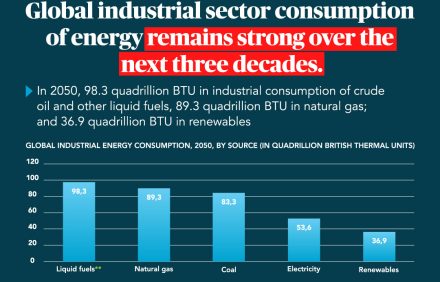
Media Gallery / Research Snapshots | January 23, 2023 GRAPHIC: Global industrial sector consumption of energy remains strong over the next three decades
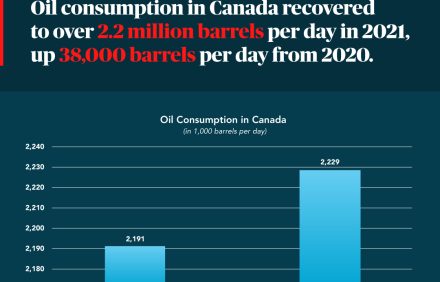
Media Gallery / Research Snapshots | January 23, 2023 GRAPHIC: Oil consumption in Canada recovered to over 2.2 million barrels per day in 2021, up 38,000 barrels per day from 202
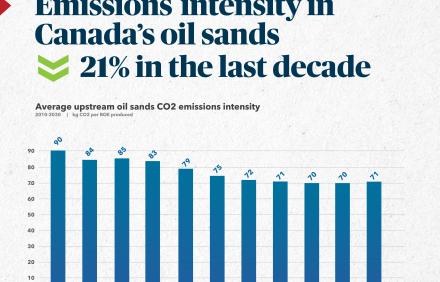
Media Gallery / Oil Sands / Research Snapshots | January 23, 2023 GRAPHIC: Emissions intensity in Canada’s oil sands decrease 21% in the last decade
Media Gallery / Research Snapshots | January 18, 2023 GRAPHIC: Since the Kyoto Summit in 1997, Canada’s share of global CO2 emissions has fallen from 2.2% to 1.5%
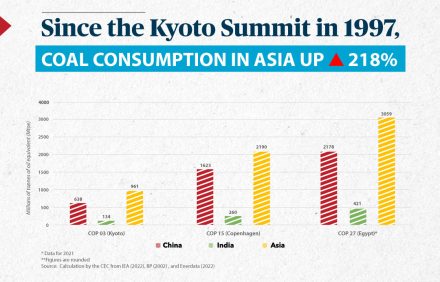
Media Gallery / Research Snapshots | January 18, 2023 GRAPHIC: Since the Kyoto Summit in 1997, coal consumption in Asia is up 218%
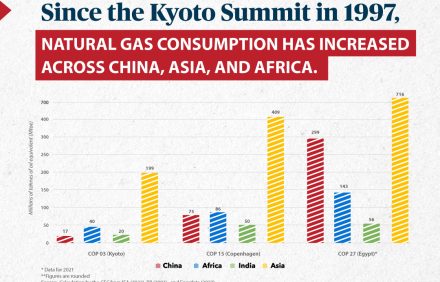
Media Gallery / Natural Gas and LNG / Research Snapshots | January 18, 2023 GRAPHIC: Since the Kyoto Summit in 1997, natural gas consumption has increase across China, Asia and Africa