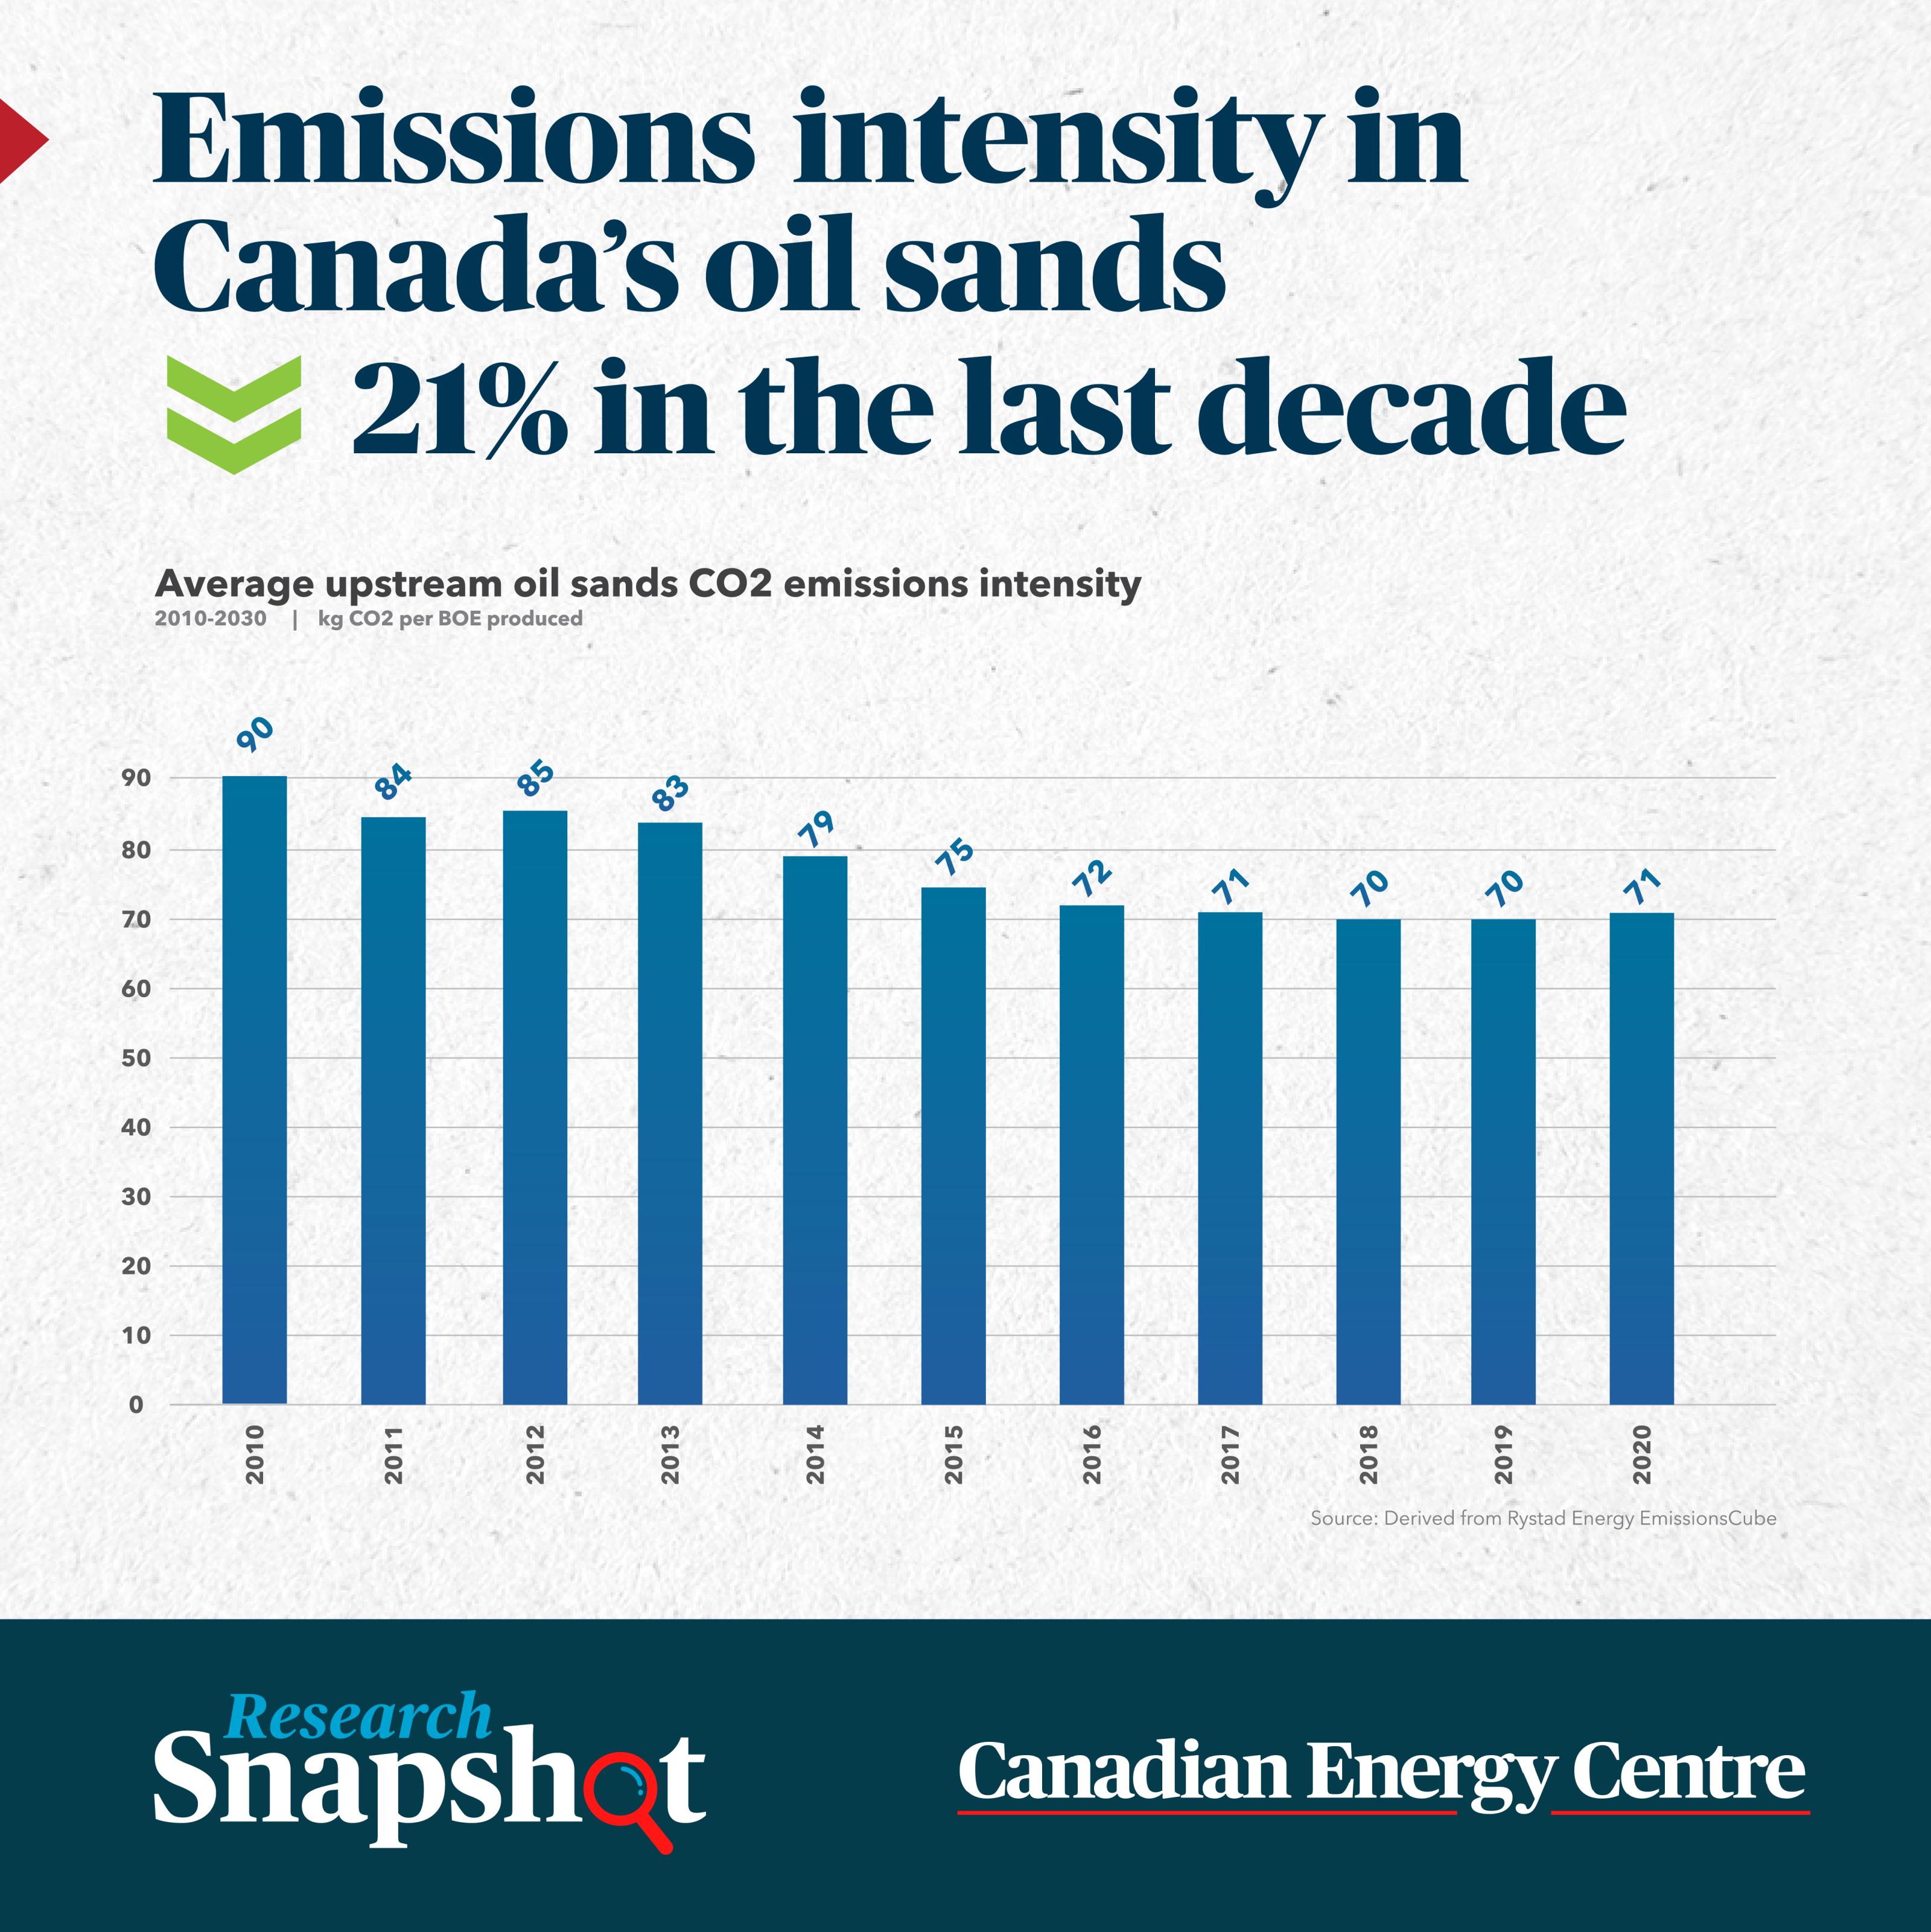
GRAPHIC: Emissions intensity in Canada’s oil sands decrease 21% in the last decade By CEC Staff on January 23, 2023, 12:54 pm MST Social Related Stories Research Snapshots | November 12, 2024 GRAPHIC: Impact of carbon tax of vehicle fuel costs Research Snapshots | September 24, 2024 GRAPHIC: Cumulative global oil investment over U.S.$13.1 trillion through 2050 Research Snapshots | September 18, 2024 GRAPHIC: Natural gas in the Canadian industrial sector
Research Snapshots | September 24, 2024 GRAPHIC: Cumulative global oil investment over U.S.$13.1 trillion through 2050