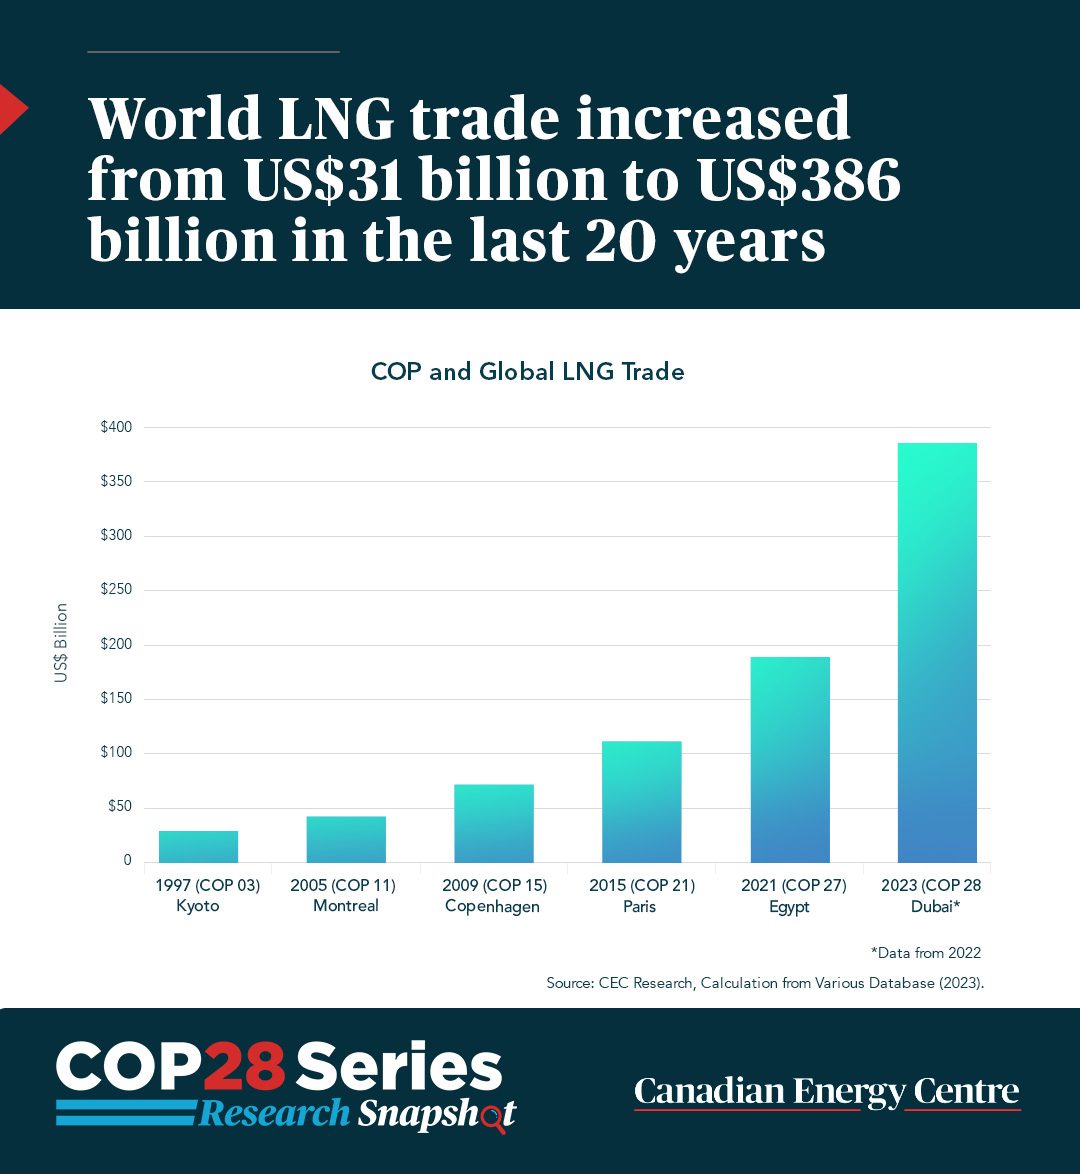
GRAPHIC: World LNG trade increased from US$31 billion to US$386 billion in the last 20 years By CEC Staff on January 4, 2024, 12:58 pm MST Social Related Stories Research Snapshots | November 12, 2024 GRAPHIC: Impact of carbon tax of vehicle fuel costs Research Snapshots | September 24, 2024 GRAPHIC: Cumulative global oil investment over U.S.$13.1 trillion through 2050 Research Snapshots | September 18, 2024 GRAPHIC: Natural gas in the Canadian industrial sector
Research Snapshots | September 24, 2024 GRAPHIC: Cumulative global oil investment over U.S.$13.1 trillion through 2050